Before you touch a single line of code or create a custom field in your CRM, you need a rock-solid blueprint for your sales funnel. This isn’t just a marketing exercise; it’s the strategic foundation for your entire go-to-market engine.
I’ve seen more data projects fail from a fuzzy, ill-defined strategy than from any technical glitch. Without a shared understanding of what each funnel stage actually means, your data pipelines will inevitably produce garbage reports, and your teams will end up in a tug-of-war over whose numbers are right.
This blueprinting phase isn’t about vague concepts like “Top-of-Funnel.” It’s about getting painfully specific. We’re creating a common language that aligns marketing, sales, and success around the same measurable goals.
Nailing Down Your Funnel Stages
First things first, let’s document the specific lifecycle stages for your business. While the exact terminology can vary, a healthy B2B SaaS funnel has a few key checkpoints that are non-negotiable. The critical part? Each stage needs crystal-clear entry and exit criteria. No ambiguity allowed.
Here’s a typical flow I see work well for most B2B SaaS companies:
- Lead: This is the absolute top of the funnel. Any new person who enters your system, whether they signed up for a newsletter or got scanned at a trade show. Quality is not a factor yet.
- Marketing Qualified Lead (MQL): Now we’re getting warmer. Marketing has vetted this lead based on who they are (firmographics) or what they’ve done (behavioral signals). Think downloading a key whitepaper or attending a deep-dive webinar.
- Sales Accepted Lead (SAL): This is the crucial handoff. An SDR has reviewed the MQL and agrees, “Yes, this person looks legitimate and is worth our time to contact.” This step prevents sales from wasting cycles on junk leads.
- Sales Qualified Lead (SQL): The SDR has connected with the lead, had an initial discovery call, and confirmed they have a real need, the authority to buy, and a potential budget and timeline (BANT).
- Opportunity: It’s real now. The lead becomes an official sales opportunity in your CRM, complete with an estimated deal size and a target close date.
- Customer: The best stage of all. The deal is marked “Closed-Won,” and you’ve got a new paying customer.
This flow represents the journey from a raw name in your database to a qualified prospect actively engaged with your sales team.
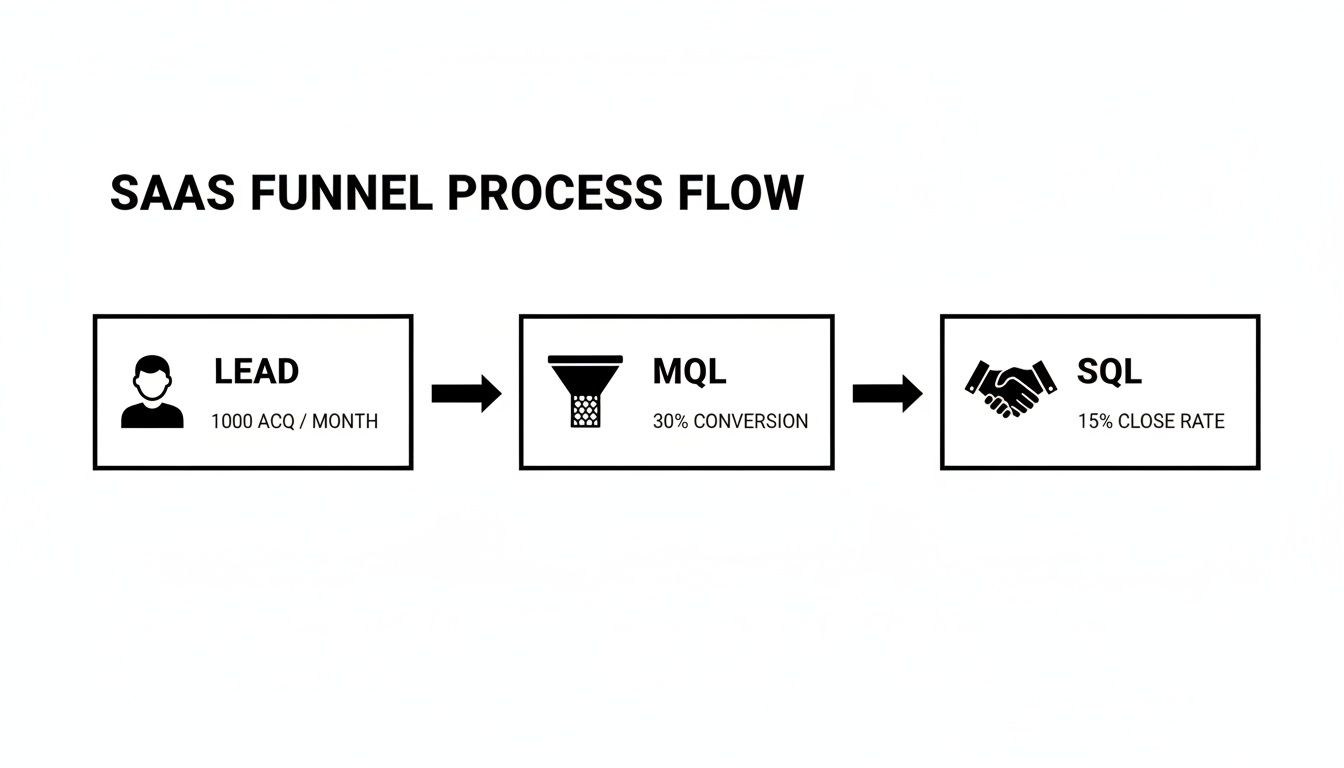
As you can see, the process is all about filtering—turning that massive pool of initial leads into a much smaller, highly valuable group of potential customers.
The table below breaks down these core stages and the metrics you’ll use to track performance. This is the kind of cheat sheet that should be taped to the wall in both the marketing and sales pods.
Core SaaS Funnel Stages and Conversion Metrics
| Funnel Stage | Definition | Primary Conversion Metric | Ownership |
|---|---|---|---|
| Lead | Any new contact in the database. | N/A (Volume tracking) | Marketing |
| MQL | A lead deemed sales-ready by marketing automation. | Lead-to-MQL Rate | Marketing |
| SAL | An MQL that the sales team has accepted for outreach. | MQL-to-SAL Rate | Sales (SDR) |
| SQL | A lead qualified via a discovery call (e.g., BANT). | SAL-to-SQL Rate | Sales (SDR) |
| Opportunity | An SQL with a defined deal size and close date. | SQL-to-Opportunity Rate | Sales (AE) |
| Customer | An opportunity that has been successfully closed. | Opportunity Win Rate | Sales (AE) |
Having this documented creates accountability and ensures everyone is measuring success the same way, from the first touchpoint to the final signature.
Mapping the Moments That Matter: Conversion Events
With your stages locked in, the next step is to pinpoint the exact events that trigger a transition. What action officially turns an MQL into an SAL? Is it when an SDR manually changes a status in Salesforce? Or does it happen automatically when a lead score crosses a certain threshold? You have to document this logic meticulously.
Your goal should be a completely deterministic model. Every single stage transition must be tied to a specific, recordable event. Any gray area here will absolutely wreck the integrity of your analytics later on.
From my experience, the MQL-to-SQL conversion rate is often the single most powerful lever you can pull in the entire funnel. For most B2B SaaS companies, a good benchmark for this rate hovers between 15% and 21%. Think about this: a five-point improvement here doesn’t just add 5% more SQLs. It can boost revenue by up to 18% because those better-qualified leads have higher downstream win rates.
When the median SaaS deal size is north of $26,000 and the sales cycle is a long 84 days, optimizing this mid-funnel handoff provides a much bigger ROI than just pouring more money into top-of-funnel ads. If you’re curious how you stack up, it’s worth digging into some pipeline performance benchmarks to see where you stand.
Setting Up Your CRM for Rock-Solid Data Capture

Think of your Salesforce instance as the central nervous system of your entire sales funnel. If your funnel blueprint is the plan, your CRM schema is the foundation it’s all built on. Get this part wrong, and every dashboard, report, and automation you layer on top will be wobbly at best.
This isn’t just about keeping data clean. It’s about building an engine that actually helps your GTM teams, rather than slowing them down with clunky processes. A well-designed CRM creates a single source of truth that sales, marketing, and success can all rely on without a second thought.
From Funnel Stages to CRM Fields
The first real step is to turn your documented funnel stages into actual fields inside your CRM. This sounds straightforward, but this is exactly where I see so many teams trip up. The common mistake is to cram everything into a single, overloaded “Status” picklist. A much smarter—and more scalable—approach is to create dedicated timestamp fields for each key transition.
Here’s a practical way to set this up on your Lead or Contact object:
MQL_Date__c(Date/Time): Automatically populates the moment a lead’s score hits your MQL threshold.SAL_Date__c(Date/Time): Stamped by an automation when a sales development rep (SDR) officially accepts the lead.SQL_Date__c(Date/Time): Marks the time a successful discovery call is completed and logged.
This approach gives you a permanent, unchangeable record of when each milestone happened. It makes calculating stage velocity—like how long a lead sat in the MQL stage—incredibly simple and accurate.
Here’s the key difference: a single status field tells you where a lead is now. A series of timestamp fields tells you the entire story of how it got there. For real funnel analytics, you absolutely need the story.
This setup is your first move toward building a truly data-driven SaaS sales funnel. It lets you pinpoint bottlenecks with cold, hard data instead of relying on gut feelings.
Building a Smarter Lead Scoring Model
A generic lead score, like adding +5 points when someone attends a webinar, is fine to get started, but it’s just scratching the surface. The real magic happens when you build a scoring model that accurately reflects buying intent and separates the tire-kickers from the truly interested prospects.
A robust model blends both demographic and behavioral signals, weighting them based on what truly matters to your business.
Demographic Scoring Factors:
- Job Title: A “VP of Engineering” is a much stronger signal than an “Intern.” Make sure your scoring reflects that.
- Company Size: Does this company fit your Ideal Customer Profile (ICP)? If you sell to the enterprise, a 10-person startup might get a lower score.
- Industry: Are they in a vertical that gets a ton of value from your product? Score those industries higher.
Behavioral Scoring Factors:
- High-Intent Actions: Not all behaviors are equal. Someone requesting a demo is leagues more valuable than someone who read a blog post. I often assign +25 points for a demo request but only +5 for a blog view.
- Recency: A flurry of activity from yesterday is way more important than a pricing page visit from 90 days ago. Your model should include score decay, where points gradually expire to keep your “hot leads” list fresh and actionable.
- Negative Scoring: Don’t forget to subtract points! Someone visiting your careers page is probably looking for a job, not a solution. The same goes for leads using personal email domains like
@gmail.comor@yahoo.com.
A thoughtful schema is what makes any dashboard meaningful. Without clean, reliable data flowing in, the charts and graphs are just pretty pictures.
Why Field History Tracking is Non-Negotiable
Finally, none of this works without strict data governance. One of the most critical—and surprisingly underused—features in Salesforce is field history tracking. By turning it on for your key funnel fields (like those stage timestamps and the lead score), you create a bulletproof audit trail.
This log captures every single change: the old value, the new value, who changed it, and precisely when they did. It’s your ultimate safety net. When a report looks weird or a lead seems to have mysteriously skipped a stage, you can instantly trace its history. To get into the weeds on this, our guide on field history tracking in Salesforce has a detailed walkthrough.
This historical data isn’t just for fixing problems. It’s the raw material you need for more advanced analysis, like building a snapshot of what your funnel looked like at the end of last quarter. That kind of analysis is simply impossible without a complete history, making this feature a cornerstone of any serious CRM architecture.
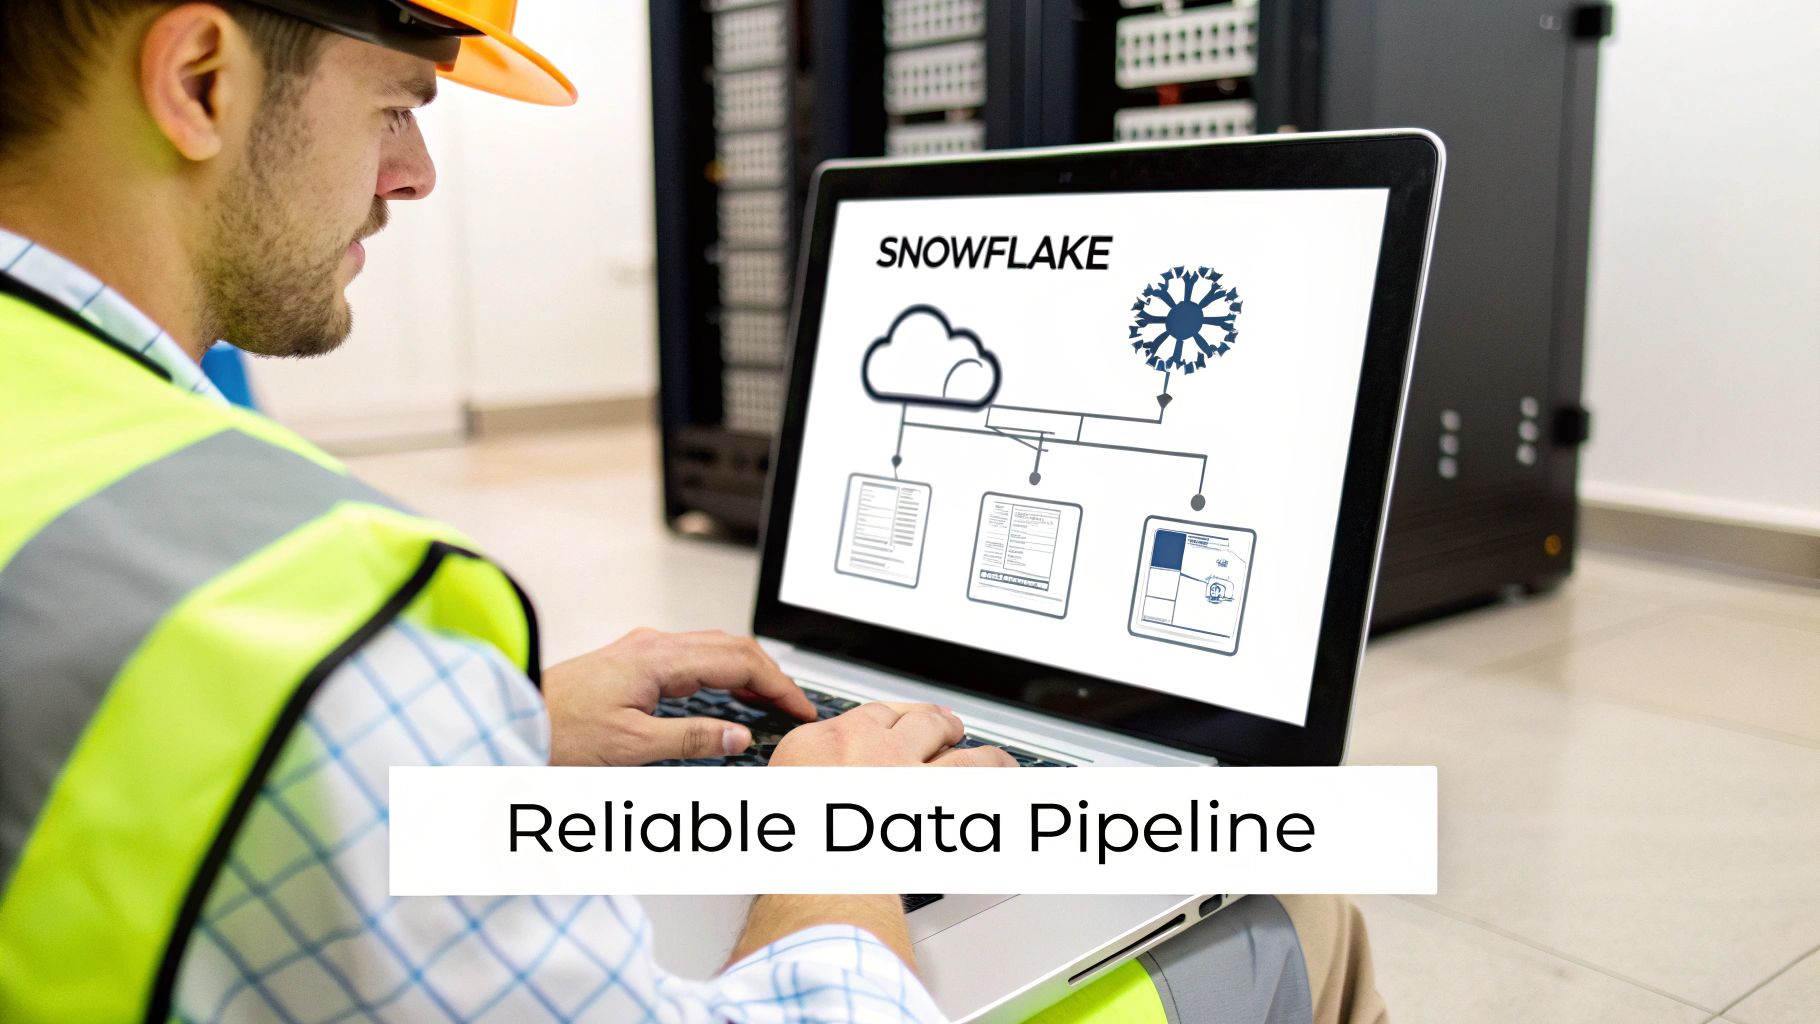
Building Resilient Data Pipelines to Snowflake
Your CRM is the beating heart of your SaaS sales funnel, but getting that raw, operational data into a warehouse for real analysis is where a lot of RevOps strategies completely fall apart. Let’s be honest: raw Salesforce data is a mess. To build dashboards that anyone actually trusts, you need a rock-solid pipeline to move that data into a modern warehouse like Snowflake.
This is where the concept of Change Data Capture (CDC) becomes your best friend. In a nutshell, CDC is a technique for spotting and grabbing only the changes made to your data, then shipping those changes over to another system in near real-time. It’s the technical plumbing that guarantees your analytics are always based on the latest intel from the sales floor.
If you’re new to the idea, our deep dive into what Change Data Capture is is a great place to start. For a SaaS business, this isn’t just a “nice-to-have.” It’s the critical link between your go-to-market engine and your strategic brain. Without it, you’re just flying blind.
Choosing Your CDC Approach
When it comes to syncing Salesforce with Snowflake, you really have two main paths you can go down: you can use a point-and-click integration tool, or you can build a more robust, engineering-first pipeline. While the no-code tools are tempting for their speed, they often hide a ton of complexity and can get incredibly brittle as your business scales.
An engineering-first approach, on the other hand, puts you in the driver’s seat.
- Point-and-Click Tools: These are fantastic for simple, one-off syncs. But they often choke on Salesforce’s complex object relationships, slam into API limits without warning, and give you very few levers to pull for monitoring or handling schema changes. When something breaks, your only option is often a support ticket and a long wait.
- Engineered Pipelines: This route means writing some code (usually with tools like Python, Airflow, or Dagster) to manage the entire data sync process. It’s more work upfront, no doubt about it. But the payoff in reliability, scalability, and observability is massive. You own the logic, the error handling, and the retry mechanisms.
For something as mission-critical as your sales funnel, investing in a durable, engineered pipeline is almost always the right call for the long haul.
Navigating Salesforce API Limits and Schema Changes
If you decide to build a custom pipeline, you’re going to run into two big challenges right away: Salesforce’s API governor limits and the fact that your schema will change. Trust me. Ignoring either of these is a fast track to broken syncs and corrupted data.
Salesforce is famously strict about how many API calls you can make in a 24-hour period. A naive pipeline that just tries to pull all your data on every run will burn through your entire quota in no time.
A well-designed CDC pipeline doesn’t just blindly copy data; it intelligently manages resources. It should use a smart combination of bulk APIs for the initial heavy lifting and then switch to incremental polls based on the
LastModifiedDatefield to only fetch records that have actually been updated.
This targeted approach slashes your API consumption, keeping your syncs humming along smoothly even as your data volume explodes.
Schema changes are the other silent killer. What happens when a sales manager adds a new picklist value or the marketing team adds a custom field to track a new campaign? A brittle pipeline will just fall over. A resilient one expects this to happen.
Best Practices for Handling Schema Drift:
- Automated Schema Detection: Your pipeline should be smart enough to see new fields in Salesforce objects and automatically add the corresponding columns in your Snowflake tables. No manual DDL required.
- Graceful Column Deletion: When a field gets deleted in Salesforce, the pipeline shouldn’t crash. A better approach is to have it nullify the corresponding column in Snowflake or mark it as deprecated, which keeps all your historical data intact.
- Type Mismatch Alerts: You need monitoring that screams at you the moment a field’s data type changes in Salesforce (like from a number to text). This kind of change can wreck downstream dbt models, so it’s something a human needs to look at right away.
By building these kinds of safeguards into your pipeline from day one, you turn it from a fragile connection into a reliable utility that can power your entire RevOps analytics stack.
Modeling Your Funnel Metrics in dbt
Alright, your Salesforce data is now landing safely in Snowflake. That’s a huge step, but right now it’s just raw material. To turn it into something your sales team can actually use, you need to clean, shape, and model it. This is where dbt (Data Build Tool) shines, stepping in as the factory floor for your analytics.
Think of dbt as the bridge between messy, raw tables and the pristine, trustworthy metrics you see in a dashboard. It’s how you take the chaos of raw CRM data and forge it into a single source of truth for your entire saas sales funnel. When you get this right, everyone—from the CRO down to the newest SDR—is working from the exact same playbook.
Structuring Your dbt Project for Funnel Analytics
Before you write a single line of SQL, take a moment to think about structure. A disorganized dbt project can become a tangled mess overnight. The most effective approach I’ve seen is a layered one, where you methodically move from raw data to business-ready models.
This “staging, intermediate, and marts” structure keeps things clean, reusable, and easy to debug.
- Staging Models: This is ground zero. Your first models will simply select from your raw Snowflake tables. The goal here is light-touch cleaning: renaming cryptic columns (
SAL_Date__cbecomessal_at), casting data types, and maybe adding some basic documentation. You’ll have one staging model for each source table. - Intermediate Models: Now we start cooking. This is where you’ll weave together different data sources and start applying real business logic. For instance, you might join your
leadsandcontactsmodels to create a single, unified view of every person. These models are the essential building blocks, but they’re not the final product you’d show to business users. - Marts Models: This is the showroom. These are the final, polished tables that your BI tools will plug into. You’ll create things like a
dim_leads(dimension) model with all the attributes for a lead, or afct_funnel_transitions(fact) model that logs every single time a lead moves from one stage to the next.
This layered approach is a lifesaver when something inevitably looks off in a dashboard. You can easily trace the data’s lineage back through the layers to pinpoint exactly where things went wrong.
The magic of dbt isn’t just that it helps you write SQL; it’s that it lets you embed your business logic directly into code. When you define
MQL-to-SQL Conversion Ratein a dbt model, that definition is now version-controlled, tested, and applied everywhere, every time. The endless debates over whose spreadsheet formula is the “right” one are finally over.
Investing in this kind of automation pays off, big time. We’ve seen funnel automation and analytics projects lead to a 15–25% revenue uplift and cut manual analytics work by as much as 80%. When you use dbt to create consistent, reliable funnel metrics, you’re building the foundation for these kinds of gains. You can read more about how funnel automation boosts revenue on Sparkco.ai.
Implementing Data Quality Tests as Your Safety Net
A data model without tests is a ticking time bomb. One of dbt’s best features is its built-in testing framework, which acts as an automated safety net for your entire pipeline. These tests run every time you build your models, catching issues long before a VP of Sales spots them in a Monday morning meeting.
You don’t need to go overboard at first. Start with a few fundamental tests on your most critical funnel models.
Essential dbt Tests for Funnel Models:
unique: You absolutely need this on the primary key of yourdim_leadsmodel. It’s a simple check to ensure you don’t have duplicate lead records, which would completely skew your conversion rates.not_null: Apply this to critical fields likelead_id,created_at, and your stage transition timestamps (mql_at,sql_at, etc.). A single null timestamp can break all of your velocity calculations.accepted_values: This is perfect for status or stage fields. For example, yourlead_statuscolumn should only ever contain ‘Open’, ‘Working’, ‘Qualified’, or ‘Disqualified’. This test prevents typos or rogue values from muddying your reports.relationships: This test confirms referential integrity. It’s like a bouncer for your data, making sure everylead_idin yourfct_funnel_transitionstable has a matching, valid record in yourdim_leadstable. No orphans allowed.
These tests are incredibly easy to add to your model’s YAML configuration file, yet the peace of mind they provide is immense. They shift your team’s focus from reactively fixing broken dashboards to proactively preventing bad data from ever being published in the first place. That’s how you build true, lasting trust in your data.
Activating Your Data with Reverse ETL
All that work building pipelines and crafting dbt models is a fantastic start, but let’s be honest—insights locked away in a data warehouse are little more than expensive reports. The real magic happens in the final step: pushing all that hard-won intelligence back into the tools your go-to-market teams use every single day.
This is exactly where Reverse ETL comes into play. It’s the bridge that closes the loop on your saas sales funnel, taking the clean, transformed data from Snowflake and syncing it back to operational systems like Salesforce. Suddenly, your sales team isn’t just staring at basic contact info; they’re seeing a rich, unified profile right inside their CRM.
This is the process that finally makes your data actionable. It tears down the wall between analytics and operations, turning your data warehouse from a dusty library into an active, intelligent engine that fuels smarter decisions in real-time.
From Insights to Action with Reverse ETL
Think about those powerful metrics you just built in dbt. Maybe you’ve created a sophisticated lead score that blends product usage with firmographic data, or a customer health score that predicts churn. Reverse ETL is the delivery service that gets these insights to your frontline teams.
A classic example is syncing your new, warehouse-native lead score directly to a custom field on the Salesforce Lead object. The difference is night and day.
- Before Reverse ETL: An SDR sees a lead’s name, title, and company. They have zero context. Did this person just download a whitepaper, or have they been living inside your product for the last week?
- After Reverse ETL: That same SDR now sees a “Product Engagement Score” of 92 and a “PQL Status” of “High-Fit, Active User” right on the lead record. They instantly know this is a hot lead that needs their immediate attention.
This single act of enrichment completely changes the game. It stops reps from wasting cycles on low-intent leads and lets them focus their energy where it actually counts. If you want to dig deeper into the mechanics, check out our guide that answers the question, what is Reverse ETL.
The core idea is simple but profound: move intelligence to the point of action. Don’t force your sales team to log into a separate BI tool to figure out who to call next. Put the answer right where they already work.
This is especially critical when you look at the economics of the funnel. Top-of-funnel benchmarks are notoriously tough, with B2B website-to-lead conversion rates often hovering around 2.3%–2.9%. Even for product-led SaaS companies, visitor-to-trial rates average only about 9%. These numbers make it clear: even tiny improvements in how you qualify and prioritize leads can have a massive downstream impact on revenue. You can find more B2B conversion benchmarks on serpsculpt.com.
Orchestrating Your Entire Data Flow
As your data stack matures, you’ll have a lot of moving parts: the CDC pipeline pulling from Salesforce, the dbt jobs transforming the data, and the Reverse ETL syncs pushing it all back. Trying to manage these as separate, disconnected processes is a recipe for disaster. This is where an orchestration tool like Dagster or Airflow becomes non-negotiable.
Think of an orchestrator as the conductor of your data symphony. It understands the dependencies between each piece, ensuring your Reverse ETL job doesn’t kick off until your dbt models have successfully run, which in turn won’t start until the raw data has landed safely from Salesforce.
This creates a single, reliable system you can monitor from one place.
A typical orchestrated workflow would look something like this:
- Extract & Load: A scheduled job kicks off the CDC pipeline to sync the latest changes from Salesforce to Snowflake.
- Transform: As soon as the raw data is loaded, the orchestrator triggers your
dbt buildcommand to run all your models and tests. - Activate: Once the dbt run succeeds, the orchestrator triggers your Reverse ETL tool to sync the freshly updated
dim_leadsandfct_funnel_transitionsmodels back to Salesforce.
If any step in this chain fails, the entire process halts, and you get an alert. This level of control is what elevates a data stack from a collection of ad-hoc scripts to a professional, production-grade system. It guarantees data freshness, ensures reliability, and gives you a single pane of glass for troubleshooting.
Your SaaS Sales Funnel Questions Answered
As you start getting your hands dirty building out a more technical SaaS sales funnel, you’re bound to run into a few common questions. I see them pop up all the time. Moving from simple reports to a full-blown data stack is a big leap, so let’s walk through some of the most frequent sticking points.
This is all about helping you navigate the strategic shifts that come with building a modern, data-driven GTM engine.
What Makes a Modern SaaS Sales Funnel Different
Look, the traditional sales funnel was a simple one-way street: Lead > Opportunity > Close. It was driven entirely by the sales team, and while it was easy to understand, it just doesn’t reflect how people actually buy software today.
Today’s SaaS sales funnel is a completely different beast. It has to be dynamic, accounting for all the non-linear ways people interact with your company. We’re talking about a much richer set of lead types, like:
- Product-Qualified Leads (PQLs): These are gold. Users who are already kicking the tires on a free trial and showing clear buying intent through their actions in your product.
- Marketing-Qualified Leads (MQLs): Leads that marketing has vetted based on who they are and what they’ve done (e.g., downloaded an ebook, attended a webinar).
- Sales-Accepted Leads (SALs): The hand-off. These are MQLs that the sales team has looked at and officially agreed to pursue.
This more cyclical model means you absolutely need a robust data architecture underneath it all. Otherwise, you’ll never get a clear picture of how marketing, product, and sales are all working together to drive revenue.
Why Not Just Use Salesforce Reports for Funnel Analytics
I get this question a lot. Salesforce reports are fantastic for quick, in-the-moment operational snapshots. If you need to see an AE’s open opportunities right now, a Salesforce report is your best friend.
But they hit a wall when you need to do any kind of serious historical analysis.
Trying to untangle complex multi-touch attribution, blend your CRM data with product usage signals, or snapshot your funnel at a specific point in time? Good luck doing that cleanly inside the CRM alone. It’s either incredibly difficult or flat-out impossible.
Building a data pipeline to a warehouse like Snowflake lets you create a unified, version-controlled source of truth. This is what unlocks powerful, trustworthy analytics that you simply can’t get from native CRM reporting.
With a proper data stack, you can finally answer the juicy questions, like, “How did our MQL-to-SQL velocity in Q2 compare to the same quarter last year?” That’s a level of insight most CRMs just weren’t built to provide.
How Should We Handle Maintenance and Technical Debt
Here’s the thing: you have to start treating your RevOps stack like a real engineering product. It’s not a “set it and forget it” project. It demands disciplined, ongoing care to stay healthy and reliable.
This proactive mindset boils down to a few key practices:
- Monitoring and Alerting: You need to know when things break. Set up automated alerts for pipeline health and data quality issues so you can catch problems before they mess up your reports.
- Version Control: Document everything. Every Salesforce schema change, every dbt model, everything should live in a git repository. It’s your safety net.
- Regular Refactoring: Just like any codebase, your dbt models will get clunky over time. You need to periodically refactor them to keep everything efficient and easy for the next person to understand.
This kind of discipline is what prevents technical debt from piling up, ensuring your SaaS sales funnel infrastructure can actually scale as your company grows.
If you’re tired of fighting with brittle pipelines and messy CRM data, RevOps JET can help. We provide on-demand RevOps engineering to build the reliable, production-grade infrastructure you need to scale. Learn more at https://revopsjet.com.