So, you need to build a data pipeline. At its core, it’s about getting data from point A to point B, but making it reliable, automated, and ready for real-world business use is where the real work begins.
We’re going to break down the entire process, from grabbing data out of your CRM to making it available for your RevOps team to build their crucial dashboards.
Your Blueprint for a Modern Data Pipeline

Let’s cut right to the chase. Building a production-ready data pipeline isn’t just about connecting a few tools; it’s about creating a system that just works. The goal here is simple but powerful: move data reliably.
Imagine your Revenue Operations (RevOps) team getting fresh CRM data synced to their warehouse every hour. This isn’t just a convenience; it means they can build dashboards that show what’s happening in sales right now. That’s how you spot trends as they emerge, manage sales territories effectively, and forecast revenue with actual confidence.
The Core Stages of Every Pipeline
Every data pipeline you’ll ever build, no matter how complex, boils down to a few fundamental stages. Getting a handle on these is the first step toward designing a system that won’t give you headaches down the road.
Before we dive deep, here’s a quick overview of the essential stages you’ll encounter. Think of this as the 30,000-foot view of your pipeline’s journey from source to insight.
Core Stages of a Data Pipeline
| Stage | Purpose | Example Tools & Technologies |
|---|---|---|
| Ingestion | Extracting raw data from its original source system. | Fivetran, Airbyte, Stitch, Custom API Scripts, Webhooks |
| Storage | A central repository for holding raw and transformed data. | Snowflake, Google BigQuery, Amazon Redshift, Databricks |
| Transformation | Cleaning, modeling, and restructuring data for analysis. | dbt (data build tool), SQL, Spark, Python (Pandas) |
| Orchestration | Scheduling, managing, and monitoring the entire workflow. | Airflow, Dagster, Prefect, Mage |
Making smart choices about the tools and methods for each stage is where experience pays off. It helps you dodge common issues and build a solid foundation from the very beginning, saving you from those late-night debugging sessions that haunt so many data projects.
A well-architected data pipeline isn’t just a technical achievement; it’s a business asset that fuels data-driven decision-making across the entire organization.
The need for people who can build these systems has absolutely exploded. Companies are drowning in data and are desperate for the infrastructure to make sense of it all. It’s no surprise the global market for data pipeline tools has ballooned, valued at over $13 billion as of 2025. This growth highlights just how critical this work has become. You can learn more about the rise of data pipeline tools and their business impact.
4. Architecting Your Pipeline for Success
Before you write a single line of code, you need a blueprint. The architectural choices you make right now will dictate whether your pipeline is a robust, scalable asset or a brittle headache that breaks every other Tuesday. This is where you lay the foundation, and getting it right saves you a world of pain down the road.
One of the first, and biggest, decisions you’ll face is the classic ETL vs. ELT debate. This isn’t just technical jargon—it fundamentally shapes how and where your data gets cleaned and modeled, impacting everything from your cloud bill to how quickly you can adapt to new business questions. It’s a crucial fork in the road.
ETL vs. ELT: The Great Debate
The old-school, traditional approach is ETL (Extract, Transform, Load). For decades, this was the only way. You’d pull data from a source, run it through a separate processing engine to clean and reshape it, and then load the final, polished version into your data warehouse.
It’s a battle-tested method, for sure. In fact, ETL data pipelines still held the largest market share at around 42% in 2025, cementing their place in standard batch processing. But the winds are changing. You can see for yourself how the data pipeline market is evolving as real-time needs grow.
The modern way, and the one that powers most cloud-native setups today, is ELT (Extract, Load, Transform). With ELT, you flip the script. You pull the raw, unfiltered data straight from the source and dump it directly into a powerful cloud data warehouse like Snowflake or BigQuery. All the transformation work happens after the data has landed, using the massive parallel processing power of the warehouse itself.
My Take: The big win with ELT is flexibility. You keep all the raw data. So, when the marketing team inevitably changes how they define a “product qualified lead,” you don’t have to re-ingest terabytes of data. You just tweak your transformation code and rerun it on the data you already have. It’s a lifesaver.
This might seem like a small difference, but it’s a game-changer in practice. In an ELT world, that change to the lead definition is a simple SQL update. In a rigid ETL world, you might be stuck rebuilding the entire pipeline from scratch, a process that can be painfully slow and expensive.
Here’s a quick breakdown to help you decide which approach fits your needs.
Comparing ETL vs ELT Approaches
| Attribute | ETL (Extract, Transform, Load) | ELT (Extract, Load, Transform) |
|---|---|---|
| Transformation Location | On a separate, dedicated processing server before loading. | Inside the target data warehouse after loading. |
| Data Loaded | Only transformed, structured data is loaded. | Raw, unstructured, or semi-structured data is loaded first. |
| Flexibility | Less flexible. Changes often require re-architecting the pipeline. | Highly flexible. Raw data is always available for re-transformation. |
| Warehouse Requirement | Works with traditional, less powerful data warehouses. | Requires a powerful, scalable cloud data warehouse (e.g., Snowflake, BigQuery). |
| Data Availability | Slower. Data is only available after the transformation step is complete. | Faster. Raw data is available for use almost immediately after loading. |
| Maintenance | Can be high. Each new requirement might need a new transformation pipeline. | Simpler. Transformations are managed in one place (e.g., using SQL/dbt). |
| Use Case | Best for structured data, compliance needs (e.g., PII removal pre-load). | Best for big data, real-time analytics, and rapidly changing business needs. |
Ultimately, for most RevOps use cases where you’re pulling from various SaaS tools, the ELT model provides the speed and adaptability you need to keep up with the business.
Choosing Your Core Building Blocks
Once you’ve picked your architectural pattern (we’re going with ELT for this guide), it’s time to choose your tools. For a typical RevOps project—like syncing Salesforce and HubSpot data into a central warehouse—you don’t need to reinvent the wheel. The modern data stack has a well-established set of go-to components.
Here’s what our stack will look like for connecting our CRM data:
- Data Warehouse (The Destination): This is the heart of your analytics. It’s where all the data lives. The big three here are Snowflake, Google BigQuery, and Amazon Redshift. These platforms are beasts, built for massive-scale analytics and are the reason ELT is even possible.
- Ingestion Tool (The Transporter): This tool handles the “E” and “L” (Extract and Load) of our ELT process. It’s the plumbing that connects your sources to your warehouse. A tool like Fivetran or the open-source Airbyte is a fantastic choice. They manage the messy API connections, automatically handle schema changes, and save you from writing and maintaining mountains of brittle, custom scripts.
- Transformation Engine (The Modeler): Once raw data is in the warehouse, you need to clean, join, and shape it into useful tables for analysis. This is the “T” (Transform). The undisputed king here is dbt (data build tool). It lets you write transformations in simple SQL, but wraps it in a powerful software engineering framework with version control, testing, and documentation.
This combo—an ingestion tool, a cloud warehouse, and dbt—is the bread and butter of the modern data stack for a reason. It’s modular, incredibly powerful, and lets data teams move at the speed of business.
Schema Design: Mind the Changes
Here’s a piece of advice I give every data engineer: plan for change, because it’s coming. Your source systems will change. It’s not a question of if, but when. The Salesforce admin is going to add that new “Lead Urgency Score” custom field, or HubSpot will deprecate an old API endpoint.
A well-designed pipeline doesn’t just work today; it anticipates tomorrow’s changes. This is another reason managed ingestion tools like Fivetran are so popular. They automatically detect schema changes at the source—a new column, a changed data type—and propagate them to your warehouse, usually without you lifting a finger. This is called schema evolution, and it’s a feature that will save your sanity.
If you’re rolling your own custom ingestion scripts, you have to build this logic yourself. Your code needs to be resilient enough to handle new fields without crashing. Trust me, ignoring this is a surefire recipe for late-night alerts and constant firefighting.
4. Getting Your Hands Dirty with Ingestion and Transformation
Alright, you’ve got the blueprint. Now it’s time to roll up our sleeves and actually move some data. This is where the rubber meets the road—where your pipeline design goes from a whiteboard diagram to a living, breathing system. First, we’ll pull data from our sources, then we’ll start shaping it into something clean and useful for analysis.
The first real step is ingestion. This is just a fancy word for getting raw data out of its home system. For anyone in RevOps, that almost always means pulling from a CRM like Salesforce, so that’s what we’ll focus on. Picking the right ingestion method is a bigger deal than it sounds; it directly impacts how fresh and reliable your data is down the line.
Choosing Your Ingestion Strategy
How you get data out of a source system really comes down to what that system lets you do. With most SaaS platforms, you’re working with APIs, which gives you two main ways to grab the data.
- API Polling (The Pull Method): This is the old standby. Your pipeline just periodically asks the source API, “Hey, what’s new since I last checked?” It’s a solid approach for batch updates and is pretty straightforward to set up. Think of a script that runs every hour to pull all new or updated contact records from Salesforce. Simple and effective.
- Webhooks (The Push Method): This is a much more modern and efficient way to do things. Instead of you asking for new data, the source system tells you when something happens. You give the source a URL (your webhook), and it pings that URL with a payload of data the instant an event occurs—like a deal stage changing from “Prospecting” to “Closed Won.”
For our Salesforce example, we’ll start with API polling. While webhooks are great for real-time needs, scheduled batch polling is usually more than enough for daily or hourly reporting. It’s also a more robust and simpler place to start when you’re building out a new pipeline.
I see this all the time: teams over-engineer for real-time data when batch processing is perfectly fine. My advice? Start simple. Hourly or daily pulls are often all you need. You can always add real-time webhooks later if there’s a compelling business reason for it.
Shaping Raw Data with dbt
Once that raw Salesforce data lands in your warehouse—let’s say it’s in a table called raw_salesforce_opportunities—the real work begins. This raw data is usually a mess. It’s often nested, inconsistent, and definitely not structured for easy analysis.
This is where the “T” in ELT comes in, and our tool of choice is dbt (data build tool).
There’s a reason dbt has basically taken over the data world: it lets you transform data using the one language every data person knows and loves—SQL. It brings all the good stuff from software engineering (like version control, testing, and documentation) to your analytics code. It turns what used to be a tangled mess of SQL scripts into a clean, maintainable, and testable workflow.
The modern ELT flow is all about getting raw data into the warehouse first and then transforming it. Tools like dbt are the engine for that in-warehouse transformation.
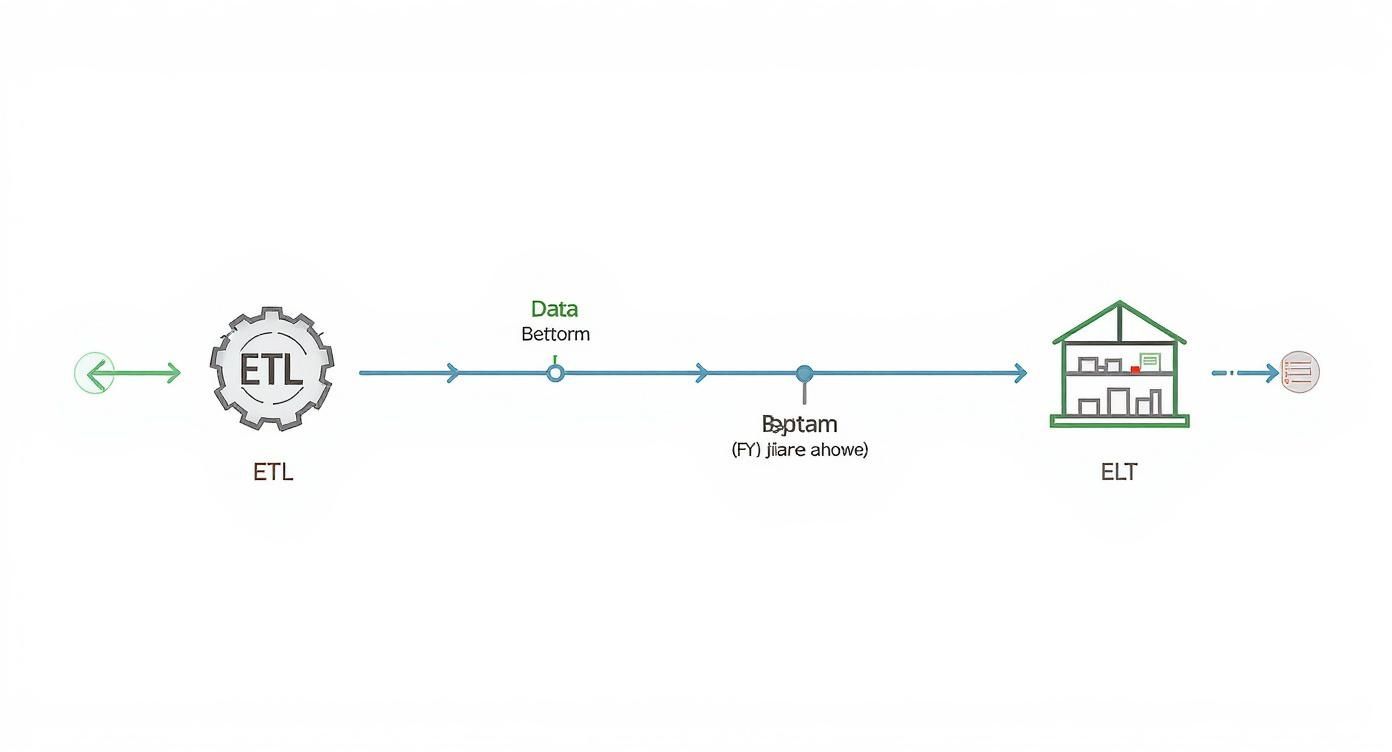
This diagram really shows why the ELT approach is so popular. By separating the ‘load’ and ‘transform’ steps, you can be way more agile and iterate on your transformations without having to re-ingest all the raw data.
A Practical dbt Transformation Example
Let’s make this real. Imagine that raw_salesforce_opportunities table I mentioned. It’s full of raw, sometimes funky, data. Our goal is to create a pristine, analytics-ready table we’ll call dim_opportunities (a “dimension” table, in data modeling speak).
We start by creating a dbt model, which is just a .sql file. We’ll call it stg_opportunities.sql. This “staging” model will be our first pass at cleaning things up.
— models/staging/stg_opportunities.sql
select id as opportunity_id, name as opportunity_name, amount, cast(close_date as date) as close_date, stage_name, is_closed, is_won from {{ source(‘salesforce’, ‘opportunities’) }}
Even in this simple query, we’re already making a big impact:
- Renaming columns to be more intuitive (e.g.,
idbecomesopportunity_id). - Casting data types to be consistent (
close_dateis now a proper date, not a string). - Referencing our raw source using dbt’s
{{ source() }}macro. This is huge because it helps dbt automatically map out all your dependencies.
But we’re not done. Next, we’ll probably want to enrich this data by joining it with account information. To do that, we’d create another model, maybe dim_opportunities.sql, that builds on top of our staging model.
— models/marts/dim_opportunities.sql
select opp.opportunity_id, opp.opportunity_name, acc.account_name, acc.industry, opp.amount, opp.close_date, opp.stage_name, opp.is_won from {{ ref(‘stg_opportunities’) }} as opp left join {{ ref(‘stg_accounts’) }} as acc on opp.account_id = acc.account_id
Just like that, with two simple SQL files, dbt can build a clean, joined table that’s infinitely more useful for the RevOps team than the raw stuff we started with. This modular, layered approach is the secret to building pipelines that are easy to understand, maintain, and grow.
As you build out your stack, it’s worth taking a look at the best data transformation tools out there to make sure you pick one that fits your team’s skills and the project’s complexity.
This whole process—layering transformations from raw sources to staging models to final, polished tables—is the heart of a modern data workflow. It’s how you turn messy operational data into a trustworthy asset that people can actually use to make decisions.
7. Orchestrating Your Pipeline for Reliability
So, you’ve written your ingestion scripts and built your dbt models. That’s a great start, but they’re just individual musicians in an orchestra. Right now, they can play their parts perfectly on their own, but without a conductor, you just have a bunch of noise.
That’s where orchestration comes in. It’s the conductor that ensures every task runs in the right order, at the right time, and—crucially—knows how to handle the inevitable hiccups along the way. A real data pipeline isn’t a collection of scripts you kick off manually. It’s an automated system that needs to run like clockwork, and orchestration tools are what make that happen.
Introducing the Power of DAGs
Modern orchestration tools like Apache Airflow and Dagster all rally around a concept called a Directed Acyclic Graph (DAG). It sounds more intimidating than it is.
A DAG is simply a way to lay out your pipeline’s workflow and define the dependencies between tasks. “Directed” means the workflow has a clear forward direction, and “Acyclic” means it doesn’t loop back on itself—it has a definitive start and a finish. This structure is perfect for laying out data pipeline logic.
Let’s apply this to our RevOps pipeline:
- Task A: Ingest raw
opportunitiesdata from Salesforce. - Task B: Ingest raw
accountsdata from Salesforce. - Task C: Run the
stg_opportunitiesdbt model. - Task D: Run the
stg_accountsdbt model. - Task E: Run the final
dim_opportunitiesmodel that joins them together.
Using a DAG, you can explicitly tell the system that Task C can’t kick off until Task A is done. And Task E, the final join, has to wait for both C and D to finish successfully. This dependency management is the absolute core of what makes orchestration so powerful. For a deeper look, you can explore some of the best data orchestration tools and see how they stack up.
Building a Resilient Workflow
The real magic of orchestration isn’t just about scheduling; it’s about building a pipeline that can heal itself. Because in the real world, things break. APIs go down, network connections get flaky, a database query times out. A good orchestrator handles these problems gracefully so you don’t have to.
The most important feature here is setting up automatic retries. Let’s say the Salesforce API is temporarily unavailable and your ingestion task fails. You really don’t want to get paged at 3 AM for something like that. Instead, you configure your orchestrator to automatically retry the task two more times, waiting five minutes between each attempt. More often than not, these transient issues resolve themselves, and the pipeline picks up right where it left off without anyone lifting a finger.
Pro Tip: When you set up retries, use exponential backoff. This just means the delay between retries gets longer each time (e.g., wait 1 minute, then 5 minutes, then 15 minutes). This is just good manners—it stops you from hammering a struggling API and gives the system a better chance to recover.
This is how you move from a fragile script to a truly resilient system. You anticipate failure and programmatically tell the system how to respond, turning a potential emergency into a total non-event.
The Critical Concept of Idempotency
Once you start using automatic retries, you run into a new and interesting problem: what happens if a task actually succeeds, but the orchestrator thinks it failed due to a network blip? If you just re-run a job that inserts data, you’ll suddenly have duplicate records flooding your warehouse.
This is why idempotency is non-negotiable. An idempotent operation is one that you can run over and over with the same input and get the exact same result every time.
Here’s a practical example for our CRM pipeline. Instead of just doing a simple INSERT of new records into a table, you perform an “upsert”—a combination of UPDATE and INSERT.
- Check First: When a new batch of opportunity data arrives, the pipeline first checks if an opportunity with that
opportunity_idalready exists in your target table. - Update or Insert:
- If it exists, the pipeline just updates the existing record with any new information.
- If it doesn’t exist, it inserts it as a new record.
With this logic in place, re-running the same ingestion task won’t create duplicates. Whether the job runs once or five times, the final state of your dim_opportunities table will be identical. Building idempotent tasks is the safety net that lets you use aggressive retry policies without the fear of corrupting your data.
Building Trust with Monitoring and Testing
A data pipeline that runs perfectly behind the scenes is great, but if your stakeholders don’t trust the numbers it spits out, what’s the point? Building that trust isn’t magic. It’s earned through a disciplined approach to monitoring and testing. This is how you go from a pipeline that merely works to one that’s truly reliable.
You can’t just cross your fingers and assume your pipeline is healthy. You have to give it a voice so it can tell you when something’s wrong. That’s the whole idea behind monitoring and observability—turning your pipeline from a black box into a transparent, understandable system.
Giving Your Pipeline a Voice with Monitoring
Good monitoring is way more than just getting a simple “pass” or “fail” notification. It’s about instrumenting your pipeline to send out signals that tell a story about its health. When something breaks, you shouldn’t have to spend an hour digging through thousands of log lines to play detective.
Your monitoring setup should immediately yell at you about critical issues, like:
- Pipeline Failures: The obvious one. If a DAG fails, your team needs an instant heads-up in a dedicated Slack channel.
- Long-Running Jobs: That job that usually takes 20 minutes is suddenly hitting the two-hour mark. This is a massive red flag. It could be a performance bottleneck, a flaky API, or a huge, unexpected dump of data.
- Weird Data Volumes: Your daily Salesforce sync normally pulls 10,000 updated records, but today it only grabbed 50. Something is definitely broken. An alert on row count changes can catch these “silent failures” before they wreck your dashboards.
Setting up these basic checks is non-negotiable. There are a ton of tools out there, and you can explore some of the most effective data pipeline monitoring tools to see what fits your stack best.
The goal here is simple: catch problems before your users do. Nothing undermines trust faster than a RevOps leader finding a bug in the weekly forecast dashboard before you even knew there was an issue.
A pipeline without monitoring is just a liability waiting to happen. It’s not a question of if it will fail, but when—and whether you’ll know about it before it causes real business problems.
Key Metrics to Track for Pipeline Health
To get started, don’t overcomplicate it. Focus on a few high-impact metrics that give you a clear, immediate picture of your pipeline’s health.
- Data Freshness: How long does it take for an event in the source system to show up in the warehouse? If your SLA is one hour, your monitoring should scream the moment that threshold is breached.
- Data Volume: Keep an eye on the row counts for your key tables after every run. Sudden spikes or drops are classic signs of upstream data issues or a failing ingestion job.
- Job Duration: Track how long each task in your DAG takes to run. If durations are slowly creeping up over time, you’ve got a performance issue brewing that you need to get ahead of.
As pipelines become more central to business operations, their use cases are evolving. While Big Data Analytics was the dominant use case in 2023, making up roughly 39% of the market, the fastest growth is now in Real-Time Analytics. This shift just highlights the growing demand for pipelines that don’t just move data, but do so with verifiable speed and reliability. You can discover more insights about data integration market trends and what they mean for the future.
Proving Accuracy with Automated Data Testing
Okay, so monitoring tells you if the pipeline ran. Testing tells you if the data it produced is actually correct. This is where you bake your business rules and assumptions right into your workflow, creating an automated quality gate.
Thankfully, modern tools like dbt make this incredibly easy. You can write tests in simple YAML files that live right alongside your data models. These tests run automatically every time your pipeline does, guaranteeing your data follows the rules you’ve laid out.
For our RevOps pipeline, here are a few absolute must-have dbt tests:
- Uniqueness: Make sure
opportunity_idin yourdim_opportunitiestable is always unique. A duplicate ID would completely throw off revenue reporting. - Not Null: The
account_idandclose_datefields should never, ever be empty. A null value here makes a record pretty much useless for analysis. - Referential Integrity: Every single
account_idin your opportunities table must exist in yourdim_accountstable. This is how you prevent “orphaned” records that can’t be joined properly. - Accepted Values: The
stage_namecolumn should only contain specific, predefined values like “Prospecting,” “Negotiation,” or “Closed Won.” A test can instantly flag any typos or rogue stages that sneak in.
By embedding these tests directly into your transformation logic, you build a powerful, self-documenting system for data quality. If a test fails, dbt can halt the pipeline, preventing bad data from ever reaching your users and giving you a crystal-clear signal of what went wrong and where. This proactive approach is how you build a data pipeline that people can truly depend on.
Common Questions I Hear About Building Data Pipelines
As you start your journey into building data pipelines, a few questions tend to pop up again and again. Let’s walk through some of the most common ones I hear to give you a bit more clarity and confidence.
What’s the Single Biggest Mistake People Make?
Hands down, the biggest misstep is diving straight into coding without a solid plan. I get it—it’s tempting to start hooking up tools and seeing data flow. But this almost always leads to a brittle pipeline that becomes a nightmare to maintain.
Engineers often get so focused on the how that they skip the why. They don’t spend enough time digging into the source data, pinning down the actual business requirements, or thinking about what might change down the road. Taking a day or two to map out your data sources, design your target schemas, and choose the right architectural pattern (like ELT) will save you countless weeks of painful debugging and refactoring later.
A day of planning can save a month of refactoring. A well-designed pipeline anticipates change, whereas a rushed one just reacts to it—usually by breaking.
How Do I Choose the Right Tools?
This is a big one. My advice? Start with your specific needs, not with whatever tool is getting all the buzz on Twitter this week. The best stack for you is the one that actually solves your problem effectively.
First, take stock of your situation. What are your data sources (APIs, databases)? What kind of data volume are you expecting? Do you need real-time data, or is batch processing fine? For a standard RevOps use case, like syncing CRM data into a warehouse, a modern stack is a proven winner:
- Ingestion: Fivetran or Airbyte
- Warehouse: Snowflake or BigQuery
- Transformation: dbt
- Orchestration: Airflow or Dagster
This combination is popular for a reason—it’s powerful and it works. If your budget is tight, the open-source options here are fantastic. The real key is to pick tools that play nicely together and align with your team’s existing skills. Don’t force a complex Python-heavy tool on a team that lives and breathes SQL; lean into your strengths.
How Can I Make Sure My Data Is Accurate?
Trust in your data is earned, not given. And you earn it through a combination of relentless automated testing and vigilant monitoring. You need to build a system that checks for quality at every single step.
Start by making automated data quality tests a non-negotiable part of your transformation process. Tools like dbt are built for this. You can define tests—like uniqueness checks, not-null constraints, and checks for accepted values—right alongside your data models.
On top of that, you need solid monitoring and alerting to keep an eye on data freshness and the overall health of your pipeline. If a job fails or a critical data quality test flunks, your team should know about it instantly. This proactive approach stops bad data in its tracks, long before it ever has a chance to mess up a stakeholder’s dashboard.
If you’re tired of fighting brittle pipelines and need production-grade RevOps engineering without the overhead of a full-time hire, RevOps JET can help. We build, monitor, and maintain the reliable data infrastructure you need for a fixed monthly fee. Get the technical expertise you need today.