Broken data pipelines are silent killers for Revenue Operations. When a Salesforce to Snowflake sync fails or a dbt model runs with stale data, the impact is immediate and painful: inaccurate forecasts, delayed reporting, and misguided sales strategies that send your team chasing ghosts. Your GTM engine relies on fresh, reliable data, but without the right visibility, you’re flying blind until a VP of Sales points out that their dashboard hasn’t updated in three days.
This guide is your shortcut to finding the right solution. We’re diving deep into the 12 best data pipeline monitoring tools that help RevOps teams detect, diagnose, and resolve these critical issues before they affect the bottom line. Forget sifting through marketing fluff; we’re giving you a practical, no-nonsense breakdown of what actually matters. You’ll get an honest look at how each tool handles alerting, data lineage, SLA tracking, and error handling.
We will explore everything from comprehensive data observability platforms like Datadog and Monte Carlo to the native monitoring capabilities within orchestrators like Airflow, Prefect, and Dagster. For each tool, you’ll find:
- A concise summary of what it does and who it’s for.
- Key features with a focus on RevOps use cases.
- Screenshots and direct links to see it in action.
- Clear pros and cons to help you make a fast decision.
Our goal is to give you a clear, actionable path to choosing a tool that prevents pipeline failures from derailing your revenue strategy. Let’s find the right fit for your stack.
1. Datadog – Data Jobs Monitoring (DJM)
If your RevOps stack relies heavily on Spark or Databricks and your company already uses Datadog for infrastructure monitoring, their Data Jobs Monitoring (DJM) product is a natural fit. It’s designed to provide a single pane of glass, unifying the performance of your data processing jobs with the health of the underlying infrastructure, applications, and even security signals. This makes it one of the most comprehensive data pipeline monitoring tools for teams wanting deep, correlated insights.
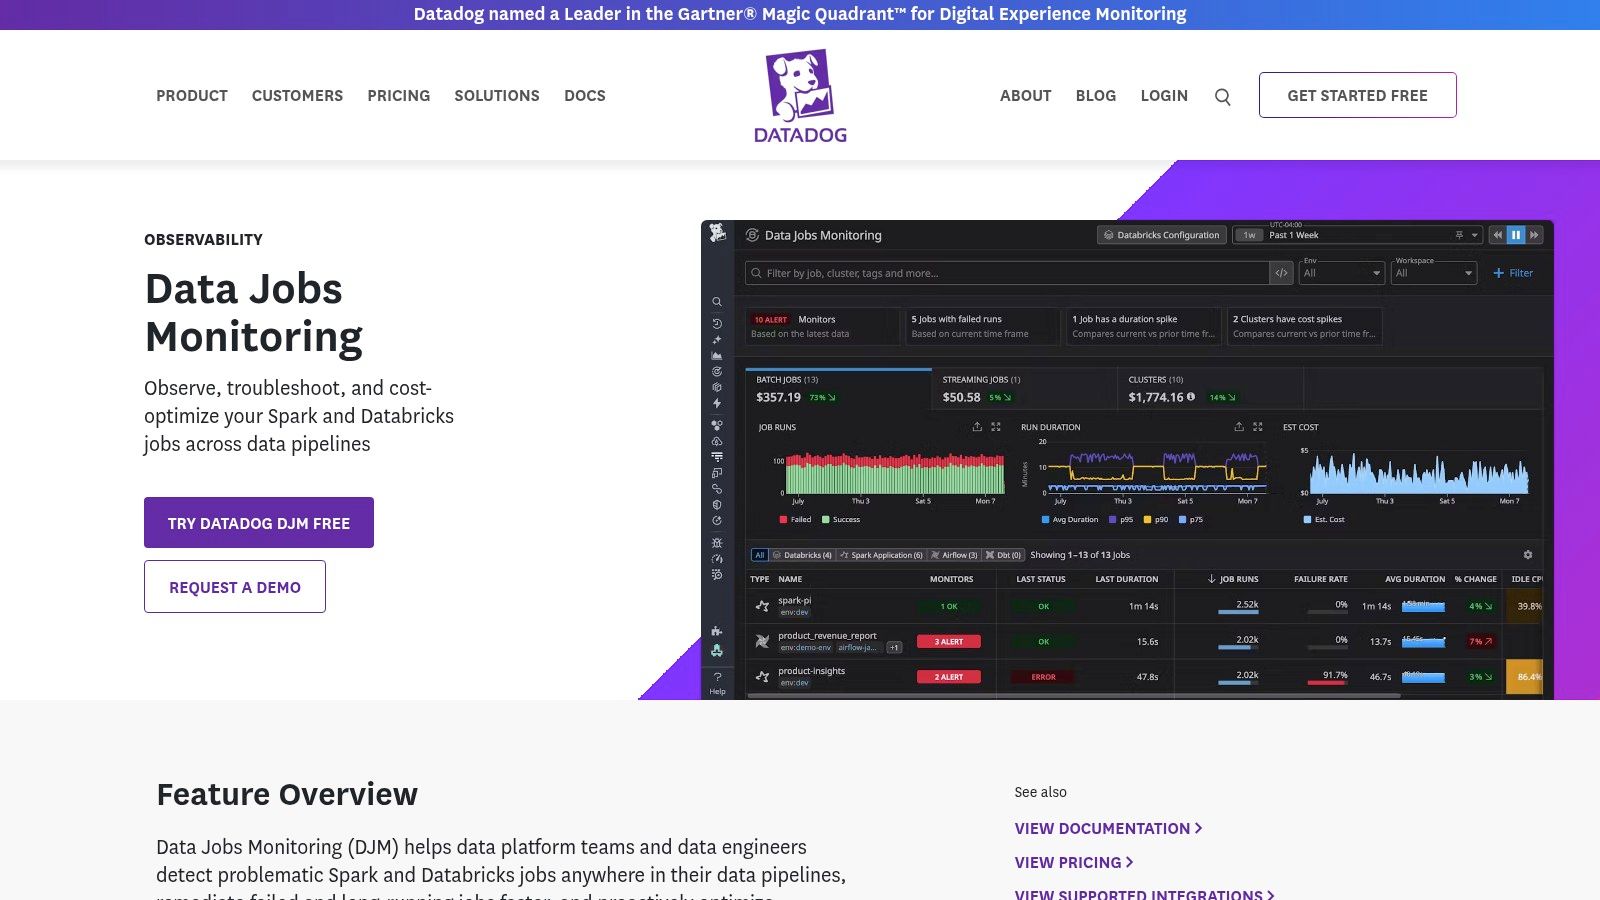
Unlike generic Application Performance Monitoring (APM) tools, DJM offers granular, stage-level and task-level traces specifically for Spark jobs. This means you can quickly pinpoint which part of your customer data sync or lead scoring model is failing or slowing down, and see if it’s related to a resource bottleneck in your cluster. It’s particularly useful for RevOps teams who need to prove that a pipeline failure isn’t just “an engineering problem” but is tied to specific infrastructure events.
Key Features & Use Cases
- Deep Spark/Databricks Visibility: Troubleshoot slow or failing jobs by drilling down into individual Spark stages, tasks, and executors.
- Cost Optimization: Identify inefficient jobs or over-provisioned clusters to reduce your data processing spend.
- Unified Monitoring: Correlate pipeline latency from Airflow with Snowflake query performance and underlying storage metrics all in one place.
- Out-of-the-Box Alerts: Set up immediate notifications for job failures, long-running tasks, and performance degradation without complex configuration.
Pricing & Implementation
- Pricing: DJM is an add-on module to the Datadog platform. Pricing is usage-based, often tied to hosts or indexed events, so costs can scale quickly. It delivers the best value if you commit to Datadog for broader monitoring needs.
- Implementation: Requires installing the Datadog agent on your data processing clusters. The user experience is excellent for those familiar with the Datadog ecosystem, but can have a steep learning curve for newcomers.
| Pros | Cons |
|---|---|
| Unifies pipeline, infrastructure, and application monitoring | Pricing can add up as you add more modules |
| Exceptional visibility into Spark and Databricks jobs | Best value if you standardize your whole stack on it |
| Powerful dashboards and correlation features | Can be overly complex for simple monitoring needs |
Find out more at: Datadog Data Jobs Monitoring
2. Monte Carlo Data – Data + AI Observability
Monte Carlo is an end-to-end data observability platform that automates monitoring across your entire data stack, from warehouses like Snowflake to BI tools. Where some tools focus on the infrastructure running the pipeline, Monte Carlo focuses on the health of the data itself. It’s designed to proactively detect data quality issues like freshness, volume anomalies, or schema changes before they impact downstream reports or customer-facing applications. This makes it one of the top data pipeline monitoring tools for teams whose biggest risk is silent data errors rather than outright pipeline failures.
For a RevOps team, this means getting an alert the moment a Salesforce data sync brings in fewer records than expected, or when a dbt transformation accidentally nullifies a key field in your customer segmentation model. Its automated, machine learning-powered monitors reduce the need for writing manual data tests, allowing the platform to learn your data’s normal patterns and alert you on deviations. The end-to-end lineage feature is a massive benefit for impact analysis, letting you instantly see which dashboards or systems are affected by a data quality incident.
Key Features & Use Cases
- Automated Data Quality Monitoring: Detects anomalies in data freshness, volume, schema, and distribution without manual rule-setting.
- End-to-End Lineage: Visually trace data from its source through ETL and BI tools to understand dependencies and assess incident impact.
- Incident Triage & Root Cause Analysis: Quickly identify the source of bad data and notify the right stakeholders directly in Slack or Teams.
- Performance Observability: Optimize query performance and compute costs in your data warehouse by identifying inefficient jobs.
Pricing & Implementation
- Pricing: Utilizes a flexible, usage-based model with credit-based tiers. A full quote requires engaging with their sales team, but its availability in the AWS Marketplace can simplify procurement and billing.
- Implementation: Connects to your data stack via API-based integrations. The setup is generally straightforward, and the platform begins learning your data patterns and providing insights relatively quickly.
| Pros | Cons |
|---|---|
| Mature enterprise features and strong security options | Pricing requires sales engagement for a detailed quote |
| Focuses on automated data quality, reducing manual tests | Credit-based model may require careful forecasting and management |
| Powerful lineage for fast impact and root-cause analysis | Less focused on the infrastructure layer than tools like Datadog |
Find out more at: Monte Carlo Data
3. Acceldata – Data Observability Cloud
Acceldata’s Data Observability Cloud is an enterprise-grade platform that goes beyond simple pipeline alerts to tackle the bigger picture of data reliability, performance, and cost governance. It’s built for organizations that view data as a strategic asset and need to manage its entire lifecycle. For a RevOps team struggling with complex, multi-system pipelines, Acceldata provides a unified command center to monitor data quality and pipeline health from source to consumption.
What sets Acceldata apart is its strong focus on cost optimization and performance management across the data stack. It doesn’t just tell you a pipeline failed; it can help you understand why a Snowflake query is suddenly costing a fortune or why a data asset is no longer fresh. This makes it one of the most comprehensive data pipeline monitoring tools for mature teams looking to apply SRE principles to their data operations and tie reliability directly to business costs.
Key Features & Use Cases
- End-to-End Pipeline Monitoring: Automatically discover and map data pipelines to monitor data freshness, volume, and schema changes across systems like Salesforce, Snowflake, and dbt.
- Data Quality Automation: Define and enforce data quality rules with anomaly detection to catch issues like duplicate lead entries or incorrect revenue figures before they impact reports.
- Cost & Performance Governance: Analyze query performance and compute usage to identify inefficiencies and govern spending across your data warehouses.
- Broad Connectivity: Extensive library of connectors ensures you can monitor data flows from various sources, including operational databases, data lakes, and business applications.
Pricing & Implementation
- Pricing: Acceldata’s pricing is not publicly listed and typically requires a custom quote tailored to your environment. It offers a 30-day free trial and demos for evaluation.
- Implementation: As an enterprise platform, implementation can be more involved than lighter-weight tools. It supports various deployment models, including on-premises and private cloud, to meet strict security requirements.
| Pros | Cons |
|---|---|
| Comprehensive platform covering quality, pipelines, and cost | Enterprise focus may be overly complex for smaller teams |
| Strong emphasis on cost optimization and SRE-style governance | Pricing is not transparent; requires engaging with sales |
| Excellent connectivity across a wide range of data sources | The sheer number of features can present a steep learning curve |
Find out more at: Acceldata Data Observability Cloud
4. Bigeye – Data Observability for Enterprise Teams
Bigeye positions itself as a data observability platform built for enterprise scale, focusing on automated data quality monitoring and deep, column-level lineage. For RevOps teams, this means it can not only tell you that a Salesforce sync failed but also help you trace the issue back to a specific transformation error in your dbt model. This lineage-first approach makes it one of the more powerful data pipeline monitoring tools for understanding the upstream and downstream impact of data issues.
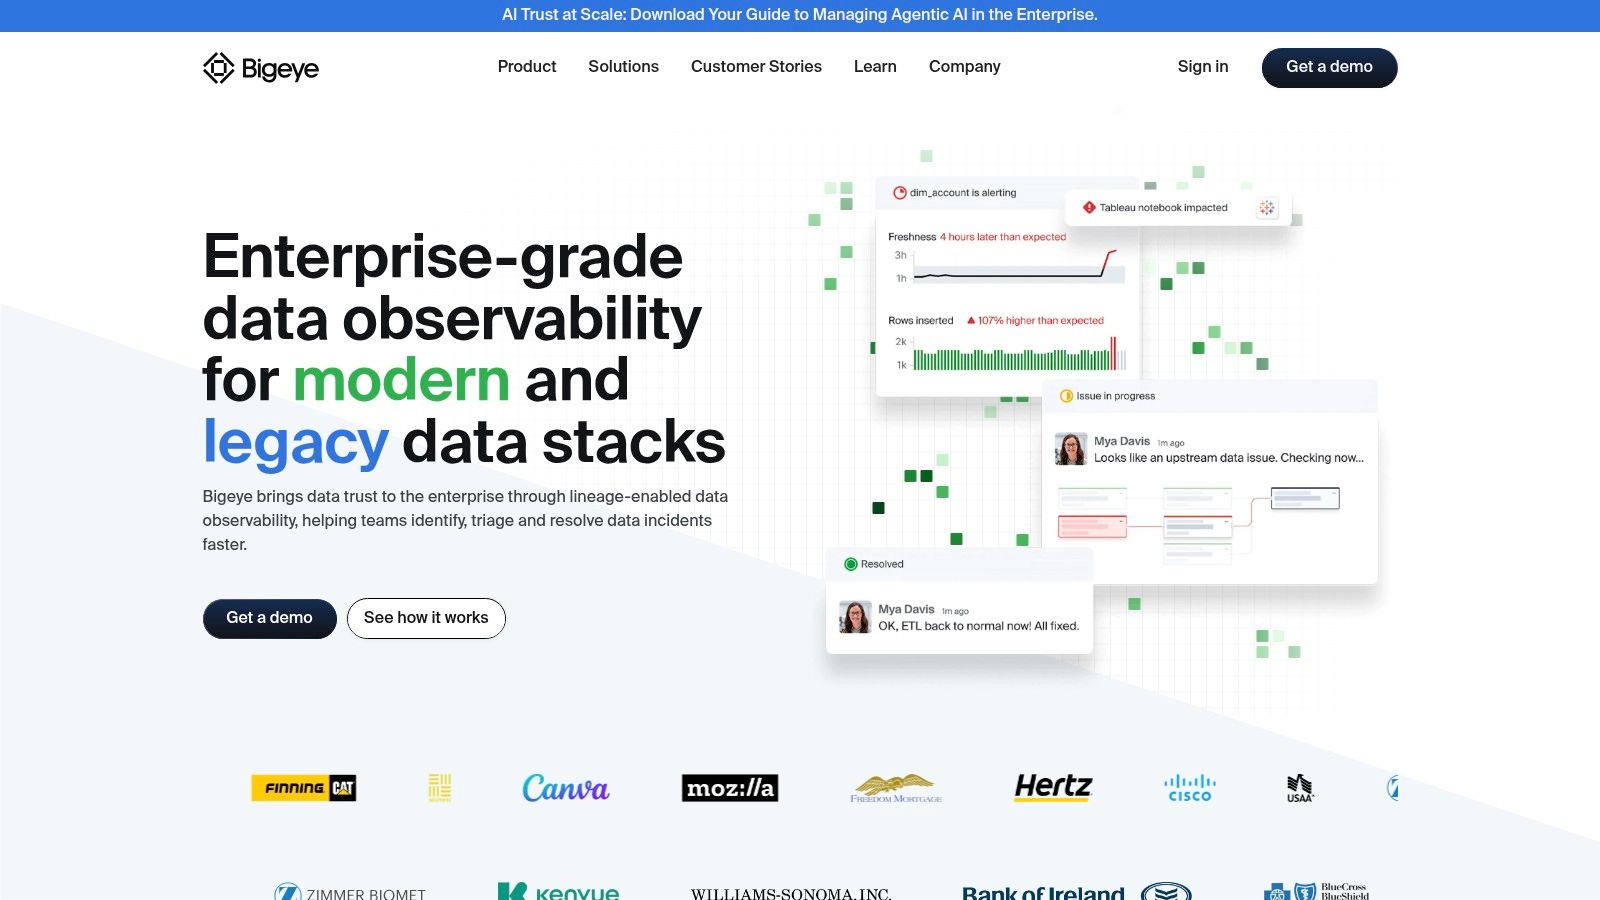
Unlike tools that only monitor job execution, Bigeye applies automated anomaly detection directly to your data assets. It learns your data’s normal patterns and alerts you when key metrics-like the freshness of a lead source table or the null rate in an opportunities field-deviate. Its BI integrations, such as a Chrome extension, can even surface data quality warnings directly within your analytics dashboards, giving business users immediate context about the data they’re consuming.
Key Features & Use Cases
- Automated Data Quality: Applies machine learning to automatically monitor data for freshness, volume, and distribution anomalies.
- Column-Level Lineage: Provides granular data lineage to perform root cause analysis on pipeline failures and impact analysis on downstream reports.
- Incident Workflows: Helps teams manage and resolve data quality issues with built-in collaboration and tracking.
- Broad Connector Coverage: Integrates with both modern and legacy data sources, ensuring visibility across your entire data stack.
Pricing & Implementation
- Pricing: Enterprise-focused pricing is not publicly listed. You’ll need to contact their sales team for a quote. It is also available via the Google Cloud Marketplace, which can simplify procurement for some organizations.
- Implementation: Connects directly to your data sources. Implementation involves configuring these connections and defining which assets to monitor, with Bigeye handling the automated metric suggestions.
| Pros | Cons |
|---|---|
| Strong lineage-driven root cause and impact analysis | Pricing is not transparent and requires sales engagement |
| Enterprise-grade connectors and BI context integrations | Marketplace billing might be a hurdle for some procurement teams |
| Excellent automated anomaly detection for data quality | Can be more complex than needed for simple pipeline monitoring |
Find out more at: Bigeye
5. Soda – Data Quality and Pipeline Testing (SaaS + Open Source)
If your team treats data quality like production code, Soda is an excellent choice. It integrates data quality testing directly into your CI/CD workflow, allowing you to catch issues before they ever reach your production CRM or analytics dashboards. Unlike all-in-one platforms, Soda focuses specifically on “checks-as-code,” making it one of the most developer-friendly data pipeline monitoring tools for teams that live in Git and orchestrators like Airflow or Prefect.
The core of Soda is its open-source framework and a YAML-based language called SodaCL. This lets you define data quality rules (e.g., “ensure no lead records have a null email address”) and run them as part of your dbt Cloud or data pipeline jobs. This approach effectively creates a quality gate, stopping bad data from propagating and alerting your RevOps team immediately when a rule fails, preventing inaccurate reporting down the line.
Key Features & Use Cases
- Checks-as-Code: Define data quality tests in simple YAML files and manage them in your Git repository alongside your dbt models or pipeline code.
- Pipeline Gating: Programmatically halt Airflow DAGs or other pipeline runs when data quality checks fail, preventing bad data from corrupting downstream systems.
- Metrics Observability: The cloud platform visualizes historical trends for your quality metrics, helping you track data health over time and route alerts to Slack or other tools.
- Broad Integrations: Connects to major data sources like Snowflake, BigQuery, and Redshift, and integrates with orchestrators and data catalogs.
Pricing & Implementation
- Pricing: Soda offers a transparent model with a free tier for small teams, alongside paid plans for more extensive monitoring, collaboration, and enterprise features. This makes it accessible for teams just starting with data quality.
- Implementation: Involves installing the open-source Soda Core library and writing SodaCL check files. Connecting to the Soda Cloud platform provides the monitoring UI and requires an API key setup.
| Pros | Cons |
|---|---|
| Developer-friendly, git-ops compatible workflow | Enterprise features are reserved for higher-tier paid plans |
| Clear, accessible pricing with a free plan for small use | Self-serve signups may be temporarily paused during product updates |
| Strong focus on preventative quality gates in CI/CD | Requires a code-centric mindset; less UI-driven than competitors |
Find out more at: Soda.io
6. Astronomer (Astro) – Managed Airflow with Observability
If your team is committed to Apache Airflow as your primary orchestrator but wants to offload the operational overhead, Astronomer is the go-to platform. It offers a fully managed Airflow experience with built-in observability features, making it one of the most effective data pipeline monitoring tools for Airflow-centric stacks. It’s not just about running DAGs; it’s about understanding their performance, health, and cost in a streamlined, developer-friendly environment.
Astro shines by simplifying the entire Airflow lifecycle. Instead of manually configuring monitoring and alerting on a self-hosted instance, you get these capabilities out of the box. This is perfect for RevOps teams who need reliable execution of their customer data pipelines but don’t have dedicated DevOps resources to manage the underlying infrastructure. It bridges the gap between powerful orchestration and operational simplicity. To dive deeper into orchestration platforms, check out our guide on the best data orchestration tools.
Key Features & Use Cases
- Managed Airflow Deployments: Easily launch, scale, and manage Airflow environments with built-in health monitoring and alerting.
- Cost Management: Usage-based pricing lets you scale workers down to zero, ensuring you only pay for what you use.
- Integrated Observability: Monitor DAG performance, task duration, and success rates directly within the Astro UI without extra setup.
- Cloud Marketplace Procurement: Simplify purchasing and billing by procuring Astro through AWS, GCP, or Azure marketplaces.
Pricing & Implementation
- Pricing: Astro offers usage-based pricing tied to cluster resources, with pay-as-you-go and committed-use options. While this provides flexibility, complex configurations can make cost forecasting difficult.
- Implementation: The user experience is excellent, with a clear and intuitive interface for deploying and monitoring Airflow. Getting started is much faster than setting up open-source Airflow from scratch.
| Pros | Cons |
|---|---|
| Streamlines Airflow operations, monitoring, and alerting | Primary value is for teams already committed to Airflow |
| Fine-grained cost control with scale-to-zero capabilities | Business/Enterprise tiers typically require a direct sales quote |
| Excellent developer experience and CI/CD integrations | Pricing can be complex depending on region and configuration |
Find out more at: Astronomer
7. Prefect – Cloud and Customer‑Managed Orchestration with Monitoring
While Prefect is a workflow orchestration platform at its core, its robust monitoring and observability features earn it a strong place among data pipeline monitoring tools. It’s built for developers who need to not just run pipelines, but also understand their state, history, and health at a glance. For RevOps teams managing complex, code-based automations like syncing custom objects to a data warehouse, Prefect provides both the engine and the dashboard.
Unlike tools that only observe, Prefect is an active orchestrator. This means its monitoring capabilities are tightly integrated with execution logic like automatic retries, conditional paths, and state-based alerting. If a pipeline fetching new leads from a marketing platform fails, Prefect doesn’t just tell you it broke; it can be configured to retry the task immediately, notify a specific Slack channel, and provide a full context of the failure, making it highly actionable for the engineering team.
Key Features & Use Cases
- Integrated Monitoring & Orchestration: View the status, logs, and history of all pipeline runs (or “flows”) directly from the same UI you use to manage them.
- Flexible Deployment Models: Choose between a fully managed SaaS solution (Prefect Cloud) or self-hosting the orchestration layer for maximum control and data privacy.
- Actionable Alerting: Configure notifications based on run states (e.g., failure, late completion) to proactively address issues in critical RevOps workflows.
- Developer-First Experience: Excellent Python SDK and CI/CD integration make it easy to version-control, test, and deploy data pipelines as code.
Pricing & Implementation
- Pricing: Offers a generous free Hobby tier. Paid plans are based on usage (successful runs) for the cloud version or per user seat for customer-managed enterprise tiers, offering predictable costs.
- Implementation: Requires writing pipelines in Python using the Prefect SDK. The learning curve is focused on its “flow” and “task” concepts, but the UI is intuitive for monitoring once pipelines are deployed.
| Pros | Cons |
|---|---|
| Combines orchestration and monitoring in one platform | Some advanced features require paid tiers |
| Flexible deployment: SaaS or self‑managed | Primarily a Python-based ecosystem, less ideal for no-code users |
| Predictable seat-based pricing for customer-managed setups | Higher tiers may be needed for production-level scale |
Find out more at: Prefect
8. Dagster Cloud (Dagster+)
Dagster takes a different approach by integrating monitoring directly into the orchestration layer. It’s an asset-first orchestrator, meaning it thinks in terms of the data assets your pipelines produce (like a Salesforce table or a dbt model) rather than just the tasks that run. This design makes it one of the more unique data pipeline monitoring tools because observability, lineage, and testability are baked into its core, not added on later.
For a RevOps team, this means you can see the health status of a specific customer data asset directly in the UI, understand its upstream dependencies, and see when it was last updated. Instead of just knowing a pipeline failed, you know which specific business asset is now stale. This provides a much more intuitive and actionable view of your data ecosystem’s health, connecting technical runs to the business intelligence assets they support.
Key Features & Use Cases
- Asset-First Model: Visualize and monitor the health of data assets, not just pipeline tasks, with built-in lineage and materialization tracking.
- Built-in Observability: Get alerts, cost insights, and detailed run histories directly within the orchestrator without a separate tool.
- Strong Developer Experience: Includes robust local development and testing capabilities, helping teams catch issues before they hit production.
- Flexible Deployment: Choose between serverless or hybrid deployments to fit your infrastructure and security requirements.
Pricing & Implementation
- Pricing: Dagster Cloud uses a transparent, credits-based usage model for its self-serve tiers, which is great for getting started. However, be mindful that higher usage can lead to overage costs. A 30-day trial is available.
- Implementation: The setup is well-documented, but adopting Dagster is a strategic choice. It works best when embraced as the central orchestrator for your data platform, as its monitoring benefits are deeply tied to its asset-based framework.
| Pros | Cons |
|---|---|
| Transparent pricing and a free 30-day trial | Credits/overage model requires usage tracking |
| Strong developer experience and testing support | Higher usage can incur unexpected overage costs |
| Monitoring and lineage are core platform features | Best for teams adopting it as their primary orchestrator |
Find out more at: Dagster
9. IBM StreamSets – Data Integration with Pipeline Monitoring
IBM StreamSets is an all-in-one platform for designing, executing, and monitoring data pipelines. Unlike tools focused solely on observability, StreamSets provides the end-to-end framework to build your pipelines and then monitor them within the same environment. This integrated approach is ideal for RevOps teams who want a single system to manage the entire data lifecycle, from ingestion to operational monitoring, without stitching together multiple tools.
The platform is built to handle both real-time streaming and batch workloads, making it versatile for various RevOps needs. For example, you can build a batch job to sync nightly lead data into your warehouse and a separate streaming pipeline for real-time customer usage events from your product. Its enterprise-grade orientation means it’s designed for reliability and scale, which is a key differentiator from lighter, more niche data pipeline monitoring tools. For those interested in real-time data movement, you can learn more about change data capture and its benefits.
Key Features & Use Cases
- Integrated Platform: Build, run, and monitor pipelines for sources like Salesforce and Snowflake in one place.
- Hybrid Workload Support: Manages both real-time streaming and large-volume batch jobs effectively.
- Data Drift Handling: Automatically detects and manages schema changes to prevent pipeline failures.
- Visual Pipeline Designer: Low-code interface allows less technical users to build and understand data flows.
Pricing & Implementation
- Pricing: Offers public, packaged pricing tiers based on Virtual Private Cloud (VPC) usage, which provides cost predictability. A cost estimator and a 30-day free trial are available.
- Implementation: As a comprehensive platform, implementation is more involved than a simple monitoring agent. It’s best suited for teams committing to it as their primary data integration solution.
| Pros | Cons |
|---|---|
| Clear, public pricing and packaging | VPC pricing may be higher than serverless options for small teams |
| Robust for both real-time streaming and batch use cases | Enterprise orientation may be heavier than lightweight SaaS tools |
| All-in-one build, execution, and monitoring platform | Less focused on observability than dedicated monitoring tools |
Find out more at: IBM StreamSets
10. AWS Glue – Data Quality and Glue‑native Pipeline Monitoring
For RevOps teams deeply embedded in the Amazon Web Services ecosystem, AWS Glue offers a native solution for both data integration and monitoring. Rather than being a standalone product, it provides monitoring capabilities as part of its broader ETL service. This makes it one of the more convenient data pipeline monitoring tools for organizations that want to consolidate their stack, billing, and identity management within AWS, using CloudWatch for alerts and dashboards.
The key advantage here is the tight integration. You can monitor the run-time metrics of your Glue jobs, track Data Processing Unit (DPU) consumption for cost management, and set up alerts for job failures or long-running tasks directly in CloudWatch. AWS Glue Data Quality, a newer feature, also lets you define rules to proactively stop bad data from entering your pipelines, a crucial function for maintaining the integrity of CRM and sales analytics data. It’s less of a dedicated observability platform and more of a built-in monitoring feature set for a specific ETL tool.
Key Features & Use Cases
- Native CloudWatch Integration: Monitor job status, duration, DPU usage, and error logs within the familiar CloudWatch interface.
- Built-in Data Quality Rules: Define and enforce data quality checks within your ETL jobs to block anomalies before they impact downstream systems.
- Cost Monitoring: Track DPU consumption with minute-level billing to understand and control your data processing costs.
- Automated Alerting: Configure CloudWatch Alarms to send notifications via SNS for job failures, timeouts, or specific error patterns.
Pricing & Implementation
- Pricing: Follows a pay-as-you-go model based on DPU-hours, billed by the second with a 1-minute minimum. Costs are granular but can become significant at high volumes.
- Implementation: Configuration is done entirely within the AWS console. While convenient for AWS users, it requires familiarity with services like CloudWatch, IAM, and S3 to set up effectively. For more info, you can check out our analysis of the best data transformation tools.
| Pros | Cons |
|---|---|
| First-party integration with AWS and unified billing | Feature depth and convenience tied to the AWS ecosystem |
| Fine-grained, usage-based pricing with calculators and examples | Per-DPU costs can increase significantly at scale |
| Proactive data quality checks can be built into pipelines | Monitoring is less comprehensive than dedicated observability tools |
Find out more at: AWS Glue
11. Google Cloud – Dataflow + Cloud Monitoring
For teams deeply embedded in the Google Cloud Platform (GCP) ecosystem, leveraging the native integration between Dataflow and Cloud Monitoring is a highly efficient choice. This combination provides a streamlined way to observe and alert on both streaming and batch data pipelines without needing third-party agents. It offers a single source of truth for pipeline performance, resource utilization, and cost, making it one of the most cohesive data pipeline monitoring tools for GCP-native stacks.
The primary advantage is its seamless, first-party integration. You can monitor key metrics like system latency, data freshness, and error rates directly within the GCP console, tying pipeline health to the underlying infrastructure. For RevOps teams, this means you can easily track the cost and performance of a specific customer data unification job or lead enrichment pipeline, ensuring it stays within budget and meets its SLA.
Key Features & Use Cases
- Native GCP Integration: Monitor Dataflow jobs using Cloud Monitoring and Cloud Logging without any external setup or agents.
- Cost and Resource Breakdowns: Gain visibility into job-level costs and resource consumption to optimize spending.
- Threshold-Based Alerting: Configure alerts for critical pipeline metrics such as processing latency, error counts, or unexpected cost increases.
- Prometheus and Logging Integration: Combine custom application metrics with structured logs for a more comprehensive observability picture.
Pricing & Implementation
- Pricing: Follows a pay-as-you-go model. Costs are based on the volume of monitoring data ingested and the number of alerting conditions configured. This transparency is great, but costs can escalate with high-volume pipelines.
- Implementation: As a native GCP service, implementation is straightforward for anyone familiar with the platform. Metrics are available out-of-the-box once a Dataflow job is running.
| Pros | Cons |
|---|---|
| First-party integration with GCP services; no extra agent | Monitoring costs are usage-based and can grow with ingestion |
| Clear, published pricing for ingestion and alert conditions | Some limitations exist for Dataflow Prime cost monitoring |
| Unified observability within the existing GCP console | Best suited for teams already committed to the GCP ecosystem |
Find out more at: Google Cloud Observability
12. Azure Data Factory – Native Pipeline Monitoring (with Azure Monitor)
For organizations deeply embedded in the Microsoft Azure ecosystem, leveraging Azure Data Factory’s (ADF) native monitoring capabilities is a logical first step. ADF integrates directly with Azure Monitor and Log Analytics to provide a centralized view of pipeline runs, activity performance, and resource utilization. This approach avoids adding another third-party tool to your stack, offering a unified diagnostic experience directly within the Azure portal.
This setup is one of the most cohesive data pipeline monitoring tools for teams that want to keep their operations, billing, and alerting consolidated within a single cloud provider. RevOps teams can use it to track the success of pipelines syncing data into Azure Synapse Analytics or other Microsoft services. The ability to programmatically access logs and metrics also allows for building custom dashboards or integrating monitoring data into internal reporting tools.
Key Features & Use Cases
- Native Azure Integration: Monitor pipeline runs directly in the ADF Studio or Azure portal without needing external tools.
- Configurable Alerting: Create alerts in Azure Monitor for pipeline failures, long-running activities, or custom metric thresholds to notify your team immediately.
- Centralized Logging: Route diagnostic logs and metrics to Azure Log Analytics to query and visualize performance across multiple data factories.
- Programmatic Access: Use SDKs and REST APIs to build custom monitoring solutions or integrate pipeline status into other applications.
Pricing & Implementation
- Pricing: ADF and monitoring costs are pay-as-you-go. You are billed for pipeline orchestration, data movement, and activity runs, plus separate charges for data ingestion and storage in Log Analytics. Costs can be complex to forecast.
- Implementation: Configuration is straightforward for those familiar with Azure. It involves enabling diagnostic settings on your Data Factory to send data to a Log Analytics workspace, where you can then build queries and alerts.
| Pros | Cons |
|---|---|
| Seamless first-party integration with the Azure stack | Native run history is limited to 45 days unless you pay for Log Analytics |
| No extra vendor management or procurement required | Monitoring and ADF operations are billed separately, which can add up |
| Powerful programmatic access for custom monitoring solutions | Can feel siloed if your data stack spans multiple cloud providers |
Find out more at: Azure Data Factory Pricing
Top 12 Data Pipeline Monitoring Tools — Feature Comparison
| Product | Core capabilities | Observability & UX | Target customers | Unique strengths | Pricing & procurement |
|---|---|---|---|---|---|
| Datadog – Data Jobs Monitoring (DJM) | Spark/Databricks job traces, pipeline alerts, cost views, infra correlation | Stage/task traces; unified dashboards; failure & latency alerts | Teams wanting single-pane APM + pipeline visibility | Deep Spark/Databricks visibility; infra/security correlation | Modular pricing can grow; 14‑day trial; best value if standardizing on Datadog |
| Monte Carlo Data – Data + AI Observability | Warehouse/lake/ETL/BI observability, field‑level lineage, incident triage | Field‑level lineage; root‑cause & impact analysis; performance observability | Enterprise analytics teams, GenAI pipelines | Mature enterprise features; security options; AWS Marketplace availability | Credit‑based tiers; sales engagement required for full pricing |
| Acceldata – Data Observability Cloud | Data quality, pipeline reliability, cost governance, broad connectors | Automated anomaly detection; platform performance & cost monitoring | Enterprise SRE/data engineering teams | Emphasis on cost optimization and SRE‑style governance | Custom quotes typical; 30‑day free trial |
| Bigeye – Data Observability for Enterprise Teams | Data quality rules, column‑level lineage, incident workflows | Lineage‑driven root cause analysis; BI integrations | Enterprise analytics teams needing lineage & BI context | Strong RCA and BI integration support | Pricing not fully public; marketplace billing available |
| Soda – Data Quality and Pipeline Testing | Checks‑as‑code (YAML), CI/CD gating, open‑source core + SaaS | Git‑ops friendly; metrics observability; alert routing | Developer-led teams, small‑to‑mid analytics orgs | Open source core; clear entry pricing; free plan | Transparent entry-level pricing; paid enterprise tiers |
| Astronomer (Astro) – Managed Airflow | Managed Airflow deployments, HA, cluster choice | Airflow health monitoring; alerts; usage-transparent billing | Teams running Airflow who want managed operations | Fine‑grained cost control; streamlined Airflow ops; marketplace procurement | Usage-based by cluster/worker; regional/configuration variance; enterprise quotes |
| Prefect – Orchestration with Monitoring | Flow/run orchestration, retries, CI/CD integrations; hybrid deploy | Flow dashboards; alerts; retries; developer ergonomics | Dev-friendly teams needing SaaS or self‑managed orchestration | Flexible deployment (SaaS/self‑managed); predictable seat pricing | Free Hobby tier; paid Starter/Team tiers; seat-based pricing |
| Dagster Cloud (Dagster+) | Asset‑first orchestration, lineage, materialization tracking | Native lineage & observability; testing support | Teams preferring asset model and strong dev tooling | Transparent published pricing; strong developer experience | Credits‑based usage with overage; 30‑day trial; published self‑serve tiers |
| IBM StreamSets – Data Integration | Pipeline design, execution, monitoring; real‑time & batch | Enterprise pipeline monitoring; scalable execution | Large enterprises with streaming & batch needs | Clear packaged pricing; robust streaming support | VPC packaged tiers; 30‑day trial and cost estimator |
| AWS Glue – Native Monitoring | AWS‑native ETL, data quality, CloudWatch monitoring | Glue checks; CloudWatch alerts & metrics; AWS integrations | AWS‑first teams and pay‑as‑you‑go users | First‑party integration and unified billing | DPU‑based metering, minute‑level billing; costs scale with usage |
| Google Cloud – Dataflow + Cloud Monitoring | Dataflow pipeline monitoring; cost & resource breakdowns | Job‑level cost/resource views; Prometheus & logging integration | GCP‑centric streaming/batch teams | First‑party GCP integration; published monitoring pricing | Pay‑as‑you‑go; monitoring ingestion costs scale with volume |
| Azure Data Factory – Native Monitoring | Managed data integration, run monitoring, alerts via Azure Monitor | Pipeline/activity run views; alerts; Log Analytics routing | Azure‑first organizations needing programmatic monitoring | Native Azure integration; SDK/REST access for automation | Unit‑based billing; 45‑day native retention (extended retention costs extra) |
Choosing Your Tool: A Quick Guide for RevOps
Navigating the landscape of data pipeline monitoring tools can feel overwhelming, but the right choice ultimately boils down to your team’s unique circumstances. We’ve explored everything from cloud-native giants like AWS Glue and Google Cloud Dataflow to dedicated data observability platforms like Monte Carlo and Bigeye, and even the powerful monitoring built into orchestrators like Prefect and Dagster. The key is to match the tool to your specific operational reality, technical stack, and business goals.
Your journey starts with a clear-eyed assessment of your current state. Are you primarily operating within a single cloud ecosystem? If your data pipelines live and breathe in AWS, GCP, or Azure, their native monitoring solutions offer a logical, tightly integrated, and often cost-effective first step. They provide essential visibility without the complexity of adding another vendor to your stack.
From Orchestration to Full Observability
For teams already leveraging modern orchestrators, the answer might be right under your nose. Tools like Astronomer, Prefect, and Dagster have invested heavily in their own monitoring and observability features. Their dashboards, automated alerts, and detailed run histories often provide more than enough insight to manage pipeline health effectively, especially for teams whose primary concern is job execution and performance.
However, if your challenges extend beyond simple pipeline failures into the murky waters of data quality, schema changes, and cross-system lineage, it’s time to look at a dedicated data observability platform. This is where tools like Monte Carlo, Soda, and Acceldata shine. They answer the critical questions that orchestrators alone cannot: Is the data itself trustworthy? For a RevOps team, where a single bad data point can cascade into flawed reporting and broken GTM automation, this level of quality assurance is non-negotiable.
The Build vs. Buy (vs. Delegate) Decision
This brings us to the ultimate strategic question: who is responsible for this? The “Build vs. Buy” framework is a classic starting point. Building a custom monitoring solution offers ultimate control but demands significant, ongoing engineering resources-a luxury most RevOps teams simply don’t have. Buying a tool solves the technology problem but still requires in-house expertise to implement, configure, and act on the insights generated.
This is where a third option emerges: delegation. The real bottleneck for most RevOps teams isn’t a lack of tools, but a lack of specialized engineering capacity. Your team’s core competency is driving revenue strategy, not debugging Airflow DAGs or configuring Datadog monitors. Investing in tools without the talent to manage them leads to shelfware and persistent data headaches.
The most effective data pipeline monitoring tools are those that are actively used by a team with the skills to interpret alerts and fix root causes. Whether you choose a cloud-native service, an orchestrator’s built-in features, or a full-fledged observability platform, success depends on having the right people in place. Your goal isn’t just to monitor pipelines; it’s to build a resilient, reliable data foundation that empowers your entire GTM team to operate with confidence.
Tired of juggling tools and fighting pipeline fires? RevOps JET provides the dedicated data engineering expertise to build, manage, and monitor your entire RevOps data stack as a fixed-cost service. Stop worrying about monitoring tools and let our team ensure your data flows reliably from Salesforce to Snowflake and back, so you can focus on driving revenue. Learn more at RevOps JET.