Learning how to forecast revenue is about bringing together your sales, billing, and product data to create a single, reliable picture of the business. Once you have that, you can apply a model—whether it’s a simple weighted pipeline or a more complex time-series analysis—and then constantly check its predictions against what actually happens.
But let’s be honest, the modeling part isn’t where most people trip up. The single most critical step is building a reliable data foundation before you write a single line of a forecast model. This is what separates a forecast that works from one that’s just a bunch of hopeful guesses.
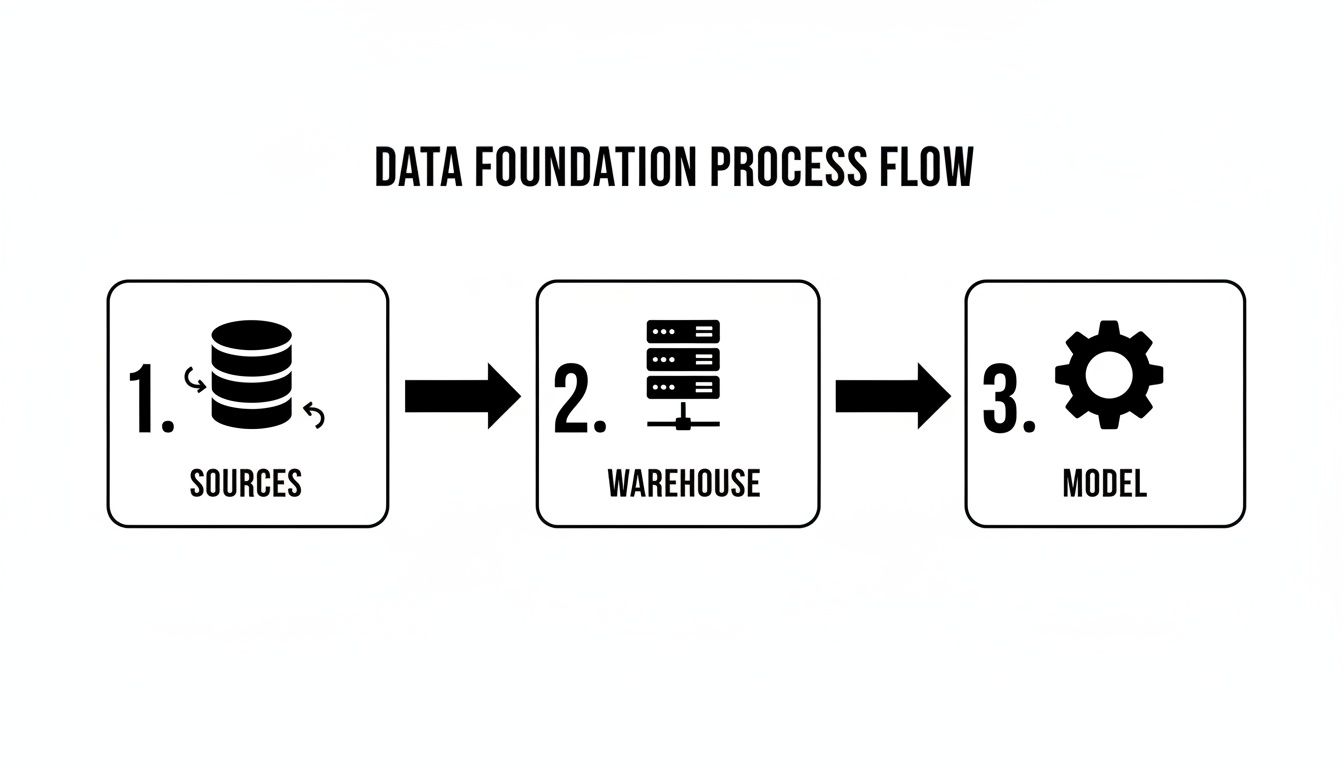
Build a Rock-Solid Data Foundation
Before you can even think about predicting the future, you have to get a firm grip on the present and the past. Forget about fancy algorithms for a minute. Real-world, accurate revenue forecasting starts with clean, unified, and trustworthy data. This is the absolute bedrock of your entire system. Any cracks here will just ripple through everything else you build.
The big goal is to create a single source of truth for all things revenue. That means finally breaking down the walls between your different systems and pulling all that critical information into one place—usually a data warehouse like Snowflake or Google BigQuery. The real challenge? Each of these systems has its own way of doing things, its own metrics, and its own “language,” making it impossible to compare them without some serious data wrangling.
Identify and Consolidate Your Core Data Sources
First things first: you need to do a data audit. It’s time to map out every single system that holds a piece of the revenue puzzle. While your company’s tech stack will be unique, most RevOps pros I know pull from three main buckets.
Here’s a quick rundown of the essential systems and what you need from them to build a truly comprehensive forecasting model.
Essential Data Sources for Revenue Forecasting
| Data Source | Key Data Points to Extract | Why It’s Critical |
|---|---|---|
| CRM (e.g., Salesforce) | Opportunity details, account info, deal stages, close dates, sales rep activity, pipeline history. | This is the heartbeat of your sales pipeline. It tells you what’s coming down the pike. |
| Billing/Financials (e.g., Stripe, Zuora) | Subscription start/end dates, contract values (ARR/MRR), churn/downgrades, payment status. | This is your ground truth. It’s what actually happened, not just what sales thinks will happen. |
| Product Analytics (e.g., Mixpanel, Amplitude) | User engagement scores, feature adoption rates, PQL signals, usage patterns. | For PLG or SaaS, this is pure gold. It surfaces leading indicators of expansion, churn risk, and conversion. |
Getting this data together is non-negotiable for an accurate forecast. Each source provides a different—and equally important—view of the business.
A classic mistake I see all the time is building a forecast using only CRM data. Without billing data, you have no way to measure your forecast’s accuracy against reality. And if you’re a PLG company ignoring product data, you’re missing the strongest signals you have about future customer behavior.
Design a Practical Data Schema
Okay, so you’ve identified your sources. Now you need a blueprint for how all this data will live together in your warehouse. A well-designed schema is what prevents the data chaos that sinks so many of these projects before they even get off the ground.
Think of it as creating a permanent, organized home for every important data point, from an opportunity stage change in Salesforce to a subscription renewal date in Stripe.
This whole process, often called data modeling, is where RevOps has become so important. We’re the ones who can connect the dots between sales, marketing, and customer success to make sure the forecast reflects the entire customer journey. Different business models need different approaches, too. For instance, most SaaS companies I work with do well with a bottom-up model built at the opportunity level. In contrast, larger B2B enterprises often rely on pipeline forecasting that also has to account for complex renewal predictions.
To pull this all together, your data integration strategy has to be solid. We’ve actually put together a roadmap for setting up reliable and scalable data pipelines in our detailed guide on data integration best practices. It’s all about making sure every piece of information, from that first lead to the post-sale check-in, is captured accurately. That’s how you set the stage for a forecast you can actually depend on.
Construct Your Automated Forecasting Pipeline
Now that you’ve mapped out your data sources and designed a solid schema, it’s time to build the plumbing. Let’s be honest: manual data pulls and clunky CSVs are the enemy of a reliable forecast. We’re moving away from those painful, periodic updates and building an automated, always-on system that keeps your models fed with fresh data.
Think of this as the engine for a modern RevOps function. This pipeline will automatically grab changes from your core systems and sync them to your data warehouse, ensuring your forecast is always built on what’s happening right now.
Setting Up Your Data Ingestion
First things first, we need to get data out of your source systems—like Salesforce and Stripe—and into your data warehouse, such as Snowflake. The gold standard for this is Change Data Capture (CDC). Instead of pulling your entire database every single time (which is slow and inefficient), CDC smartly identifies and copies only the new or updated records. It’s a game-changer for efficiency and reduces the strain on your production systems.
You don’t have to build this from scratch. Tools like Fivetran, Stitch, or Airbyte are lifesavers here. They come with pre-built connectors that handle all the tricky parts of CDC right out of the box. You just connect your sources, point them to your warehouse, set a schedule, and you’re off. In a matter of hours, you can have a steady stream of raw data flowing in, laying the foundation for everything that comes next.
This diagram gives you a great high-level view of how this all fits together in a modern data stack.
As you can see, it’s all about systematically centralizing that raw, messy data and then refining it into the clean, trustworthy tables your forecasting models need to work their magic.
For a much deeper look at the tools and strategies involved, check out our guide on how to build a modern data pipeline.
Transforming Raw Data with dbt
Just because your data has landed in Snowflake doesn’t mean it’s ready for prime time. It’s still raw—full of inconsistent naming, messy fields, and sitting in separate tables. This is where dbt (Data Build Tool) becomes your best friend.
dbt is a fantastic tool that lets you transform all that raw data using simple SQL SELECT statements. But here’s the kicker: it wraps your SQL in a software engineering workflow, giving you powerful features like version control, automated testing, and documentation. You stop writing brittle, one-off scripts and start building a library of modular, reusable SQL models that fit together like LEGOs.
Your dbt project will typically have a few layers:
- Staging Models: Think of these as a light-touch cleanup crew. They take the raw data from each source, rename columns for consistency, cast data types correctly, and do some basic filtering. One staging model per source table. Simple.
- Intermediate Models: This is where you start creating real value by joining your different data sources together. For example, you might join your Salesforce opportunity data with your Stripe subscription data to finally connect a “Closed-Won” deal to its actual recurring revenue.
- Marts: These are the final, polished tables, ready for your forecasting models and BI tools. A
monthly_revenue_forecastmart, for instance, would be a wide table containing everything you need: opportunity details, historical revenue, product usage signals, and even sales rep performance metrics.
The real magic of dbt is how it handles dependencies. It automatically understands that your
monthly_revenue_forecastmart depends on those intermediate joins, which in turn depend on your staging models. When you run it, dbt builds everything in the correct order, every single time. No more manual orchestration headaches.
By treating your data transformations as code, you create a process that’s testable, version-controlled, and transparent. Anyone on the team can see exactly how a metric was calculated, building the trust you absolutely need in your forecast numbers.
Choosing the Right Revenue Forecasting Method
Alright, with your data pipeline humming along nicely, we get to the fun part: picking your forecasting model. Let’s be clear, there’s no single “best” way to do this. The right choice really comes down to your business model, how much historical data you have, and how complex your sales cycle is.
The goal isn’t to find a magic crystal ball. It’s about choosing a practical tool that gives your leadership team the intelligence they need to make smart decisions. Let’s walk through the most common methods, starting simple and working our way up.
Rule-Based Forecasting
This is forecasting at its most basic and a fantastic place to start. A rule-based forecast is pretty much what it sounds like—it uses simple, binary logic. A deal is either in or out of the forecast based on a clear set of rules you define. You’re not messing with percentages; you’re just making a “yes” or “no” call on each opportunity.
You’ll typically see categories like:
- Commit: These are the deals your reps have verbally confirmed are closing this quarter. It’s based purely on their sentiment and confidence.
- Best Case: This includes everything in your “Commit” bucket, plus any opportunities sitting in the final proposal or negotiation stages.
- Pipeline: This is the whole shebang—every active opportunity, no matter what stage it’s in.
This approach is quick, easy for everyone to understand, and doesn’t require a mountain of data. It’s perfect for early-stage companies where historical data is thin and the sales process is still finding its feet. The big catch? It leans heavily on rep subjectivity, which, let’s be honest, can sometimes be a little too optimistic.
Weighted-Pipeline Forecasting
This is probably the most common method you’ll run into, and it’s a logical next step up. With weighted-pipeline forecasting, you assign a probability-to-close percentage to each stage of your sales process. Then, you just multiply each deal’s value by the probability of its current stage and add it all up.
For instance, your stages might be weighted something like this:
- Discovery: 10%
- Proposal Sent: 50%
- Negotiation: 80%
So, a $100k deal in the “Proposal Sent” stage would contribute $50,000 to your forecast. The absolute key here is to base these percentages on your actual, historical win rates for each stage, not just a gut feeling. This is where you start layering in some real data-driven objectivity that rule-based models are missing.
Cohort and Time-Series Analysis
Once your business starts to mature—especially if you’re in SaaS or another subscription model—you need to think beyond just the deal-by-deal pipeline. Cohort analysis involves grouping customers by a shared trait, usually their sign-up month, and then tracking their revenue over time. This is gold for understanding retention, expansion revenue, and lifetime value, all of which are essential for a solid long-term forecast.
Time-series forecasting, on the other hand, examines your historical revenue data as a whole to spot patterns like seasonality, growth trends, and cycles. It helps answer questions like, “Why do we always see a dip in Q3?” or “Is our growth actually speeding up?” You’ll need at least two or three years of clean historical data for this to be truly effective, but it’s fantastic for predicting your baseline revenue trajectory.
Choosing the right method often reflects your company’s scale and complexity. The global advertising revenue market, for instance, shows how critical market-specific forecasting is. WPP Media’s forecast projects an 8.8% global growth in 2025, but that masks huge regional differences. The U.S. is expected to grow at a 3.8% rate, while China’s media revenues are projected to rise at a 6.1% CAGR, demonstrating that a one-size-fits-all model doesn’t work at scale. Discover more insights from the WPP Media end-of-year forecast.
Machine Learning Models
Finally, you have Machine Learning (ML). This is where things get really sophisticated. An ML model uses algorithms to analyze dozens, or even hundreds, of different signals—way more than any human could possibly track. It might look at deal size, industry, the sales rep’s track record, product usage data from a free trial, and even the number of email exchanges to predict how likely a deal is to close.
The power of ML is its uncanny ability to find non-obvious patterns that simpler methods would miss. For example, it might learn that deals over a certain size in the finance industry that get stuck in negotiation for more than 14 days have a near-zero chance of closing. While incredibly powerful, ML models require a ton of clean data and serious technical know-how to build and maintain. This is usually the territory of mature companies with a dedicated data science resource.
Comparison of Forecasting Methods
Deciding on a method can feel overwhelming, so I’ve put together a simple table to help you compare the different approaches at a glance. Think about where your company is today and where you plan to be in a year or two.
| Forecasting Method | Best For | Complexity Level | Key Advantage |
|---|---|---|---|
| Rule-Based | Early-stage startups with limited data | Low | Simple to implement and understand |
| Weighted-Pipeline | Growing businesses with a defined sales process | Medium | Blends rep input with historical data |
| Cohort & Time-Series | Mature subscription businesses (SaaS) | High | Predicts long-term and recurring revenue |
| Machine Learning | Large enterprises with deep data sets | Very High | Uncovers hidden patterns for high accuracy |
Ultimately, the best forecasting “stack” often involves a combination of these methods. You might use a weighted pipeline for your core quarterly forecast and a time-series model to set your annual top-down revenue goals. The key is to start with what’s manageable and build from there.
Validate and Deploy Your Forecasting Model

Let’s be honest: a forecast you can’t trust is worse than no forecast at all. It’s actively misleading. Once you’ve picked a model and built it out, the real work begins—proving it actually works and then turning it into a reliable, automated system.
This is where you graduate from a cool analytics project to a core strategic asset for the business. The goal is to ditch the manual, spreadsheet-fueled headaches for an automated engine that serves up fresh, trustworthy numbers on a predictable schedule. This frees up your team to act on insights, not just crunch numbers.
Proving Your Model with Backtesting
Before you even think about showing your new forecast to leadership, you need to build your own confidence in its predictive power. The only way to do that is through backtesting.
The process is simple in concept: you run your model against historical data to see how well its predictions would have matched what actually happened. For instance, you could grab your sales pipeline data from the start of Q1 last year and have your model predict the quarter’s revenue. Then, you simply compare that prediction to the actual revenue you booked in Q1, which you already know from your billing data.
Backtesting isn’t just a pass/fail test. It’s an iterative process of discovery. When you see a huge variance, you can dig in and ask why. Did a massive, unexpected deal close? Was a key assumption in your model just plain wrong? Each discrepancy is a chance to fine-tune your logic and make the model smarter.
This is how you earn your seat at the table. When your CFO asks, “How do we know this number is right?” you can confidently say, “We ran this model against the last four quarters, and it was accurate within 5% each time.” That’s a conversation changer.
Smart Deployment and Orchestration
Once you’ve validated the model and trust its accuracy, it’s time to put it into production. The magic word here is orchestration—automating the entire end-to-end process, from pulling fresh data to delivering the final numbers.
A solid, orchestrated workflow should look something like this:
- Trigger Data Syncs: The whole process kicks off by refreshing data from sources like Salesforce and Stripe into your data warehouse.
- Run dbt Transformations: Next, your dbt models fire in the correct sequence to clean, join, and prepare the final data mart your forecast depends on.
- Execute the Forecast Model: The forecasting logic itself—whether it’s a block of SQL or a Python script—runs on top of this freshly prepared data.
- Publish the Results: The output gets written to a final table, which then pipes the numbers directly into your BI dashboards, Slack alerts, or wherever else they need to go.
Tools like Apache Airflow, Dagster, or the scheduler built right into dbt Cloud are perfect for this. They let you map out this entire sequence as a DAG (Directed Acyclic Graph), making sure each step runs successfully before the next one even thinks about starting.
Setting a Realistic Cadence
So, how often should this whole thing run? It really depends on the rhythm of your business. A company with a fast, high-volume sales cycle might need a daily refresh. On the other hand, an enterprise SaaS business with a nine-month sales cycle could be perfectly fine with a weekly or even bi-weekly update.
The beauty of an automated system is its flexibility. You can set a standard cadence but also trigger manual runs on-demand right before a board meeting or during end-of-quarter planning. This ensures your teams are always working with the freshest, most reliable data, turning your forecast from a static report into a living, breathing tool for making smarter decisions.
Keep Your Forecasting System Healthy and Accurate

So, you’ve built an automated revenue forecast. That’s a huge win, but let’s be clear: this isn’t a “set it and forget it” project. Think of your forecasting system as a living, breathing part of your RevOps stack. It needs regular care to stay sharp.
Your business is always in motion. Sales territories shift, new products get launched, and the CRM schema gets tweaked. If you don’t actively maintain your model, the accuracy you worked so hard for will slowly erode, leaving you with a forecast that’s completely out of touch with reality.
Get Ahead of Problems with Data Observability
The single biggest threat to your forecast’s credibility is silent data failures. It could be a broken API connection, an unexpected change to a Salesforce field, or a sudden spike in null values. These issues can quietly poison your data, and you might not notice until your forecast is wildly off.
This is where data observability becomes your best friend. Instead of waiting for a bad number to sound the alarm, observability tools constantly monitor your data pipelines for trouble. They keep an eye on key metrics like freshness, volume, and schema integrity.
If you’re new to the concept, we have a guide that breaks down what is data observability and why it matters. It’s a game-changer for maintaining trust in your numbers.
Modern platforms can ping your team in Slack the moment something looks off. For instance, you could set an alert for when the number of “Closed-Won” deals synced from Salesforce yesterday hits zero. That’s a massive red flag that something is broken, and catching it early means it never corrupts your forecast.
Create a Living Runbook
Every complex system needs a manual, and your forecast is no exception. A runbook is a live document that spells out everything someone needs to know to manage, troubleshoot, and evolve the system. Don’t let this critical knowledge get siloed in one person’s head.
Store it somewhere the whole team can access, like Confluence or a shared Git repo. Here’s what it should cover:
- Maintenance Routines: A simple checklist for regular health checks, like reviewing model accuracy against actuals every month.
- Troubleshooting Steps: What to do when common alerts fire. If a dbt run fails or a key data source goes stale, what’s the first move?
- Model Retraining Protocol: A clear plan for when and how to update your logic. For example, you might refresh your weighted-pipeline percentages annually based on fresh win-rate data.
- Contact List: A go-to list of who owns which data source or pipeline component.
Think of this document as your insurance policy. It protects you against knowledge loss when team members move on and ensures your forecast stays healthy for the long haul.
A well-maintained forecasting system doesn’t just predict the future; it helps create it. By keeping a constant pulse on its performance, you ensure your leadership team is always making decisions based on the most accurate and timely information available.
Monitor and Iterate Relentlessly
Finally, build monitoring into your team’s regular rhythm. Set up a dedicated dashboard in your BI tool that tracks forecast accuracy over time. Every month, compare what your model predicted against the actual revenue that came in. This creates a tight feedback loop that drives constant improvement.
When you spot a significant gap, treat it as a learning opportunity. Was it a one-off business event the model couldn’t possibly have known about? Or is there a fundamental flaw in its logic that needs fixing? This cycle of monitoring, questioning, and refining is how you turn a good forecast into an indispensable strategic asset.
The shift toward this kind of dynamic, data-rich forecasting is already delivering results. Companies using AI-powered revenue intelligence have reported a 10-20% bump in forecast accuracy, with some even hitting 95% accuracy. Better yet, they’re seeing a 25% increase in deal closures and shrinking sales cycles by 15-30%. To see how data-driven approaches are changing the game, discover more insights about AI sales forecasting. This level of performance is within reach, but only if you treat your system like a product that requires ongoing care and development.
Answering Your Top Revenue Forecasting Questions
Even after you’ve built a solid data pipeline and your model is humming along, questions will inevitably pop up. That’s because a revenue forecast isn’t just a technical report; it’s a living document that needs to create a shared understanding of where the business is headed.
I’ve been in countless meetings where RevOps leaders wrestle with the same challenges. Let’s break down some of the most common sticking points and how to think through them.
How Often Should We Update Our Revenue Forecast?
Honestly, there’s no magic number here. The right cadence really depends on the speed of your business and the length of your sales cycle.
If you’re running a high-velocity, transactional sales motion (think SaaS with monthly subscriptions), you absolutely need to be looking at this weekly, if not bi-weekly. Things change fast, and you need to be able to react to shifts in lead volume or conversion rates on the fly.
On the other hand, if you’re in the enterprise world with sales cycles stretching from six to twelve months, a monthly or even quarterly forecast usually does the trick. The key is to align your forecasting rhythm with your planning rhythm. The real game-changer is having an automated data pipeline. It gives you the power to refresh the forecast whenever you need it—right before a big board meeting or during a particularly shaky quarter.
What’s the Biggest Mistake Companies Make?
I see this one all the time: relying 100% on subjective “commit” calls from the sales team without any objective data to back it up. Look, sales reps are optimists by nature—it’s a crucial part of their job. But that optimism can easily lead to a bloated pipeline and a forecast that’s more hope than reality.
A truly solid forecasting system doesn’t just take a rep’s word for it. It cross-references their forecast with cold, hard data from your warehouse. You should be checking their “commit” against things like historical win rates for that deal size, how long the opportunity has been sitting in its current stage, and even product engagement signals.
It’s all about blending the art with the science. You need the qualitative insights from the field, but you have to ground them in quantitative analysis. Without that balance, you get a forecast that’s neither realistic nor defensible. An equally fatal flaw? Messy CRM data. Garbage in, garbage out—no model can fix that.
We’re Still on Spreadsheets. How Do We Even Start?
Making the leap from spreadsheets to an automated system feels like a huge mountain to climb, but it doesn’t have to be. The secret is to start small and get a quick win. Don’t try to boil the ocean on day one.
First, just focus on getting your two most important datasets into one place. That means pulling opportunity data from your CRM (like Salesforce) and your actuals from your billing system (like Stripe). Getting these synced into a data warehouse like Snowflake or BigQuery is surprisingly easy these days with tools like Fivetran.
Once the data is flowing, use a tool like dbt to write a few simple models that join those two sources together. Your only goal for version one should be to compare what you thought you were going to close against what you actually closed. Start with a basic weighted-pipeline model. It will immediately show you where your forecasts have been off in the past and give you a foundation to build on. Remember the mantra: progress, not perfection.
How Can We Factor in Seasonality and Market Trends?
This is where you graduate from simple pipeline math and start dipping your toes into time-series analysis. To do this well, you really need to look at your historical revenue data—ideally at least two or three years’ worth—to spot those recurring patterns, like the classic Q4 year-end rush or the summer slowdown.
To layer in bigger market trends, you can start incorporating external data (like macroeconomic indicators) or even just internal leading indicators, like website traffic or lead volume. For instance, if you’ve seen a sustained 20% jump in marketing qualified leads over the past quarter, it’s reasonable to apply a growth factor to your forward-looking forecast. This is where machine learning models really shine, as they can detect these complex signals automatically, but a well-built time-series model is a powerful place to start.
At RevOps JET, we build and maintain the production-grade data pipelines and automated forecasting systems you need to get reliable numbers. If you’re ready to move beyond spreadsheets and subjective guesses, let’s talk. Learn more at https://revopsjet.com.