Customer success metrics are your direct line of sight into how well you’re keeping, growing, and delighting your customers. These aren’t just abstract numbers; KPIs like Net Revenue Retention (NRR) and Customer Health Score are the tangible link between your team’s day-to-day work and the company’s bottom line.
Defining the Customer Success KPIs That Actually Matter
Before you can even think about measuring success, everyone on your team needs to agree on what “success” actually looks like. Without clear, universally understood KPIs, your customer success managers are flying blind, putting in the work but never quite sure if it’s making a real difference. The idea is to cut through the noise of vanity metrics and zero in on the numbers that directly impact revenue and customer loyalty.
Think of your core KPIs as the vital signs for your entire customer base. A doctor wouldn’t diagnose a patient without checking their heart rate and blood pressure, right? In the same way, a CS leader uses these metrics to get a clear, unbiased reading on the health of their accounts. This shift to a data-driven mindset is what elevates customer success from a reactive support function to a proactive, revenue-generating force within the business.
From Satisfaction to Revenue
The whole field of customer success has matured. A decade ago, a CS team’s performance might have been judged by how many support tickets they closed or their latest CSAT score. And while those things are still part of the picture, they don’t capture the full financial impact.
Today, the conversation is all about revenue. This isn’t just a trend; it’s a fundamental shift in understanding that a happy customer is good, but a successful and growing customer is what builds a sustainable business. Your company’s long-term health is directly tied to its ability to keep and grow its existing customers, and the modern CS team is right at the heart of that mission.
The data backs this up. An overwhelming majority of companies now connect customer success performance directly to financial results. In fact, recent surveys show that a staggering 93.7% of companies now measure their CS team’s impact using a revenue target like Gross or Net Revenue Retention. You can dig into more of these trends in the latest customer success statistics on custify.com.
Core Customer Success KPIs and Their Business Impact
Here’s a quick reference guide to the customer success KPIs that truly matter, what they tell you, and why they’re so critical for your business.
| KPI | What It Measures | Why It’s Important |
|---|---|---|
| Net Revenue Retention | The percentage of recurring revenue retained from existing customers, including expansion. | Measures your ability to not only keep customers but also grow their value, directly impacting sustainable growth. |
| Gross Revenue Retention | The percentage of recurring revenue retained, excluding any expansion or upsells. | A pure measure of retention that reveals the true financial impact of churn and downgrades. |
| Customer Health Score | A predictive score indicating the likelihood of a customer to churn, renew, or expand. | Acts as a leading indicator, allowing CSMs to proactively intervene with at-risk accounts before they churn. |
| Product Adoption Rate | The percentage of customers actively using key product features that drive value. | Shows if customers are getting the intended value from your product, which is a strong predictor of retention. |
| Customer Lifetime Value | The total revenue a business can expect to generate from a single customer account. | Helps in making strategic decisions about customer acquisition costs, resource allocation, and segmentation. |
This table gives you a solid starting point for the metrics you should be tracking. These aren’t just numbers on a dashboard; they are the indicators that guide strategic decisions and daily actions for your entire team.
Key Takeaway: The most effective customer success strategies balance lagging indicators that measure past results (like NRR) with leading indicators that predict future outcomes (like Customer Health Score). Relying on one without the other gives you an incomplete picture of your business.
Building Your Data Foundation for CS Metrics
Trustworthy customer success KPIs don’t just magically appear on a dashboard. They’re the end result of a carefully planned and well-built data pipeline. Before you can even begin to trust your NRR or churn numbers, you need a solid foundation. That means getting clean, timely data out of your source systems and into a structured environment where it can be properly modeled.
The whole process kicks off by figuring out where your data actually lives. For most SaaS companies, this boils down to two key places: your CRM (like Salesforce) and your application’s production database. Salesforce is your source of commercial truth—it’s got the contracts, subscription details, and account ownership. Your product database, on the other hand, holds the behavioral truth—how customers are actually using your platform.
Extracting and Loading Your Raw Data
Getting this data out reliably is the first big hurdle. For something like Salesforce, you need more than just the current state of an object like an Opportunity or Subscription; you need to see how it changes over time. This is where Change Data Capture (CDC) becomes an absolute game-changer. CDC is a technique that identifies and tracks changes made to your data, letting you stream those updates to your data warehouse in near real-time.
Instead of running massive data dumps every night, which can be painfully slow and hog resources, CDC sends only the incremental changes. This ensures your data warehouse always has a fresh and accurate history of every single customer interaction, upgrade, downgrade, or cancellation. Without it, you’re always looking in the rearview mirror, working with stale information.
This entire flow is about turning raw user actions into insights that actually drive revenue.
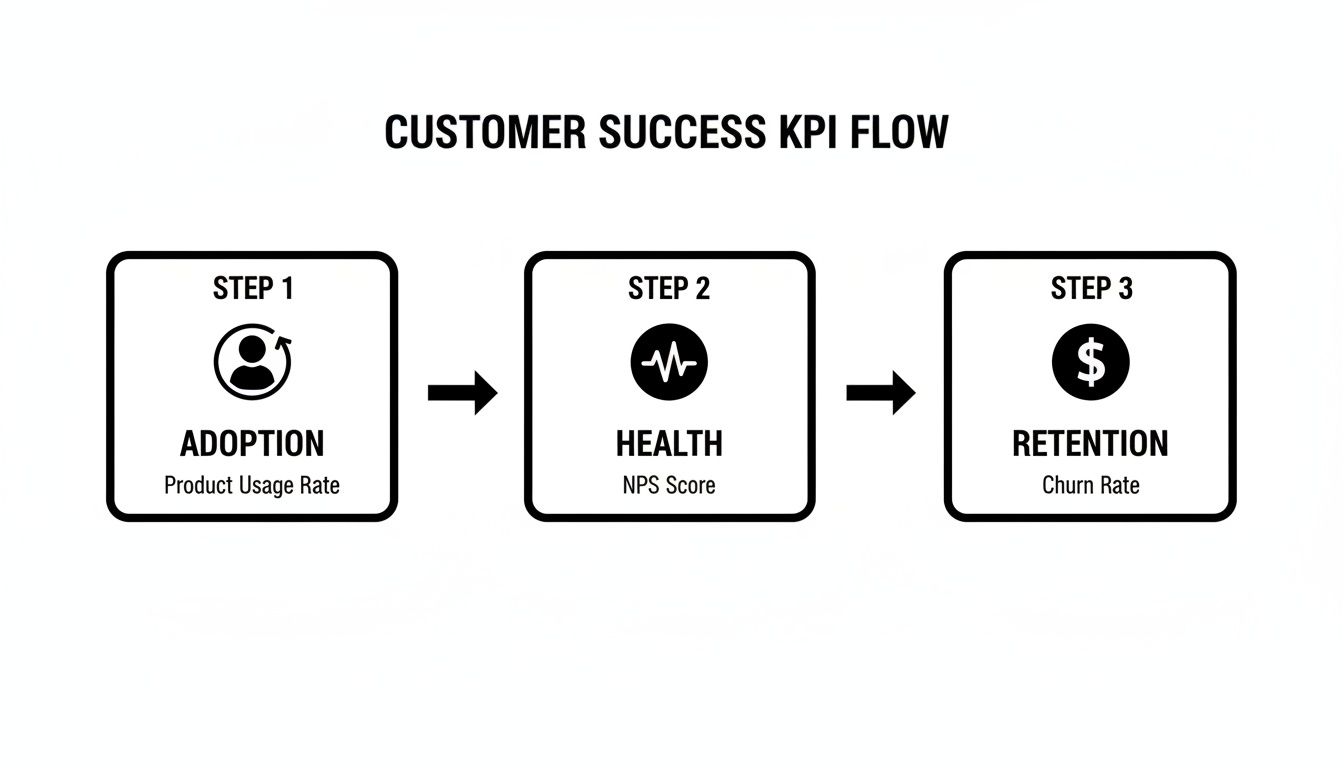
As you can see, leading indicators like product adoption directly influence customer health, which in turn drives those critical, revenue-based outcomes like retention.
Transforming Data with dbt
Once your raw data is flowing into a data warehouse like Snowflake, the real work begins. Let’s be honest—raw data from different systems is usually a mess. You can’t just join a Salesforce Opportunity table with a product users table and expect anything meaningful to come out. This is exactly why a transformation tool like dbt (data build tool) is so essential.
With dbt, you can write, document, and test all your data transformations using simple SQL SELECT statements. It helps you build a logical, layered data model that turns chaotic raw data into clean, analysis-ready tables. Think of it as the factory where you assemble raw materials into a finished product—in this case, reliable customer success KPIs.
The first step in any dbt project is creating your “staging” models. These are foundational models that do the initial clean-up on your raw data. This typically includes:
- Casting data types: Making sure dates are dates and numbers are numbers.
- Renaming columns: Creating consistent naming conventions (e.g.,
account_idinstead ofAccountIdoracct_id). - Basic calculations: Adding new fields you’ll need for analysis later on.
These staging models serve as a clean, standardized layer that all your other models can build upon. It’s a simple step that prevents redundant work and ensures everyone is on the same page. If you want to dig deeper into this, check out these data integration best practices.
Modeling Customers and Subscriptions Accurately
With your clean staging data ready, you can now build the core models for your customer success KPIs: a robust customers table and a subscriptions table. This is where you get into the weeds and handle the complex business logic that reflects the messy reality of SaaS.
Your customers table should become the single source of truth for every account. In most cases, you’ll be joining data from Salesforce accounts with user data from your product database to create a complete 360-degree view.
The subscriptions table is arguably the most critical—and most complex—model you’ll build. It needs to track the financial relationship with each customer over time, perfectly.
A common pitfall here is only looking at the current subscription status. A truly effective subscriptions model tracks the entire lifecycle of a customer’s contract, including every upgrade, downgrade, and renewal. This creates a historical log of MRR changes over time.
This historical view is the secret sauce that lets you accurately calculate your most important KPIs, like NRR and GRR. Without a well-modeled subscriptions table that can handle these complex scenarios, your metrics will be flawed and untrustworthy, which can easily lead to some poor strategic decisions.
Let’s Get Our Hands Dirty: Writing the SQL for Your Key KPIs

Alright, the data foundation is solid. Now for the fun part: rolling up our sleeves and turning that business logic into actual code. This is where the rubber meets the road—writing the SQL and dbt models that will churn out your customer success KPIs.
Getting this right is so much more than just nailing the syntax. We’re building queries that need to be dead-on accurate, easy for the next person to understand, and tough enough to handle the messy reality of a subscription business.
The real goal here isn’t just to spit out a number. It’s to forge a single source of truth for each KPI. When you codify these definitions in dbt, you’re building a system that everyone—from the C-suite to the newest CSM—can trust implicitly. It’s the ultimate cure for the classic “my report says X, but your report says Y” headache.
Calculating Net Revenue Retention
Ah, Net Revenue Retention (NRR). It’s the undisputed king of SaaS metrics, but it’s also surprisingly easy to get wrong. The big idea is to see how revenue from a specific group of customers has changed over time, factoring in both the good (expansions) and the bad (churn and downgrades).
To pull this off, you absolutely need a monthly subscriptions model that tracks Monthly Recurring Revenue (MRR) for every customer. We usually call this fct_mrr in our projects, and it becomes the bedrock for almost every revenue-based KPI you’ll ever build.
Here’s a look at a simplified dbt model for NRR. This code assumes you’ve already built that fct_mrr table containing customer_id, mrr_month, and mrr_amount.
— models/marts/kpis/nrr_kpi.sql
with monthly_mrr as ( select customer_id, date_trunc(‘month’, mrr_month) as mrr_month, sum(mrr_amount) as mrr from {{ ref(‘fct_mrr’) }} group by 1, 2 ),
retained_revenue as ( select this_month.mrr_month, sum(last_month.mrr) as retained_mrr_base, — MRR from customers 12 months ago sum(this_month.mrr) as current_mrr_from_cohort — Their MRR today from monthly_mrr as this_month join monthly_mrr as last_month on this_month.customer_id = last_month.customer_id and this_month.mrr_month = dateadd(month, 12, last_month.mrr_month) group by 1 )
select mrr_month, current_mrr_from_cohort / retained_mrr_base as net_revenue_retention from retained_revenue order by mrr_month desc
What this query does is find a specific group of customers from exactly 12 months ago, then compares their total MRR back then to their total MRR today. Simple, elegant, and accurate.
Tackling Customer and Revenue Churn
Churn is another one of those metrics that feels simple on the surface but demands real precision under the hood. For any CS team, it’s probably the most critical operational metric they track, as it hits recurring revenue directly.
A healthy SaaS business might have an annual revenue churn around 5–10%, but it’s not uncommon to see that number jump to 15–30% or more for younger companies still finding their footing. (If you want to dive deeper, there are some great SaaS industry benchmarks on OrbaCloudCFO you can check out.)
We typically break churn into two distinct types:
- Customer Churn (Logo Churn): What percentage of our customers left?
- Revenue Churn: How much MRR did we lose from those departing customers?
Let’s build a practical SQL model for monthly logo churn, leaning on our trusty fct_mrr model again. The core logic here is to find customers who were paying us last month but have an MRR of zero this month.
— models/marts/kpis/customer_churn_kpi.sql
with monthly_customer_mrr as ( select customer_id, mrr_month, mrr > 0 as is_active from {{ ref(‘fct_mrr’) }} ),
churn_flags as ( select customer_id, mrr_month, lag(is_active, 1) over (partition by customer_id order by mrr_month) as was_active_last_month, is_active from monthly_customer_mrr ),
churn_events as ( select mrr_month, count(distinct customer_id) as churned_customers from churn_flags where was_active_last_month = true and is_active = false group by 1 )
select * from churn_events
This query is great because it cleanly flags the exact month each customer churned. From there, you just need to aggregate the data and divide it by the total number of active customers at the start of the month to get your churn rate.
A Quick Pro Tip: As your dataset grows, these kinds of complex queries can really start to slow down and rack up costs. Making sure your SQL is written efficiently from the start is a lifesaver. If you’re hitting performance walls, it’s worth exploring some powerful SQL query optimization techniques to keep your pipelines snappy.
Modeling Customer Lifetime Value
Customer Lifetime Value (CLV) is all about looking into the future. It’s an estimate of the total revenue you can realistically expect from a customer over their entire relationship with you. A solid CLV calculation is part historical data, part educated guess.
A really common and effective way to calculate it relies on two main ingredients:
- Average Revenue Per Account (ARPA): What’s the average MRR we get from an active customer?
- Customer Lifetime: How long, on average, does a customer stick around? This is just the inverse of your churn rate (1 / Customer Churn Rate).
The formula itself is pretty simple: CLV = ARPA / Customer Churn Rate.
Here’s how we can set up a dbt model to calculate the pieces we need for CLV each month.
— models/marts/kpis/clv_inputs.sql
with customer_churn as ( — Reference your churn model from above select * from {{ ref(‘customer_churn_kpi’) }} ),
total_active_customers as ( select mrr_month, count(distinct customer_id) as active_customers from {{ ref(‘fct_mrr’) }} where mrr > 0 group by 1 ),
total_mrr as ( select mrr_month, sum(mrr) as total_mrr_value from {{ ref(‘fct_mrr’) }} group by 1 )
select m.mrr_month, m.total_mrr_value / a.active_customers as arpa, c.churned_customers / a.active_customers as monthly_churn_rate from total_mrr m join total_active_customers a on m.mrr_month = a.mrr_month join customer_churn c on m.mrr_month = c.mrr_month
See what we did there? By building out modular dbt models for each component—churn, active customers, total MRR—we can easily stitch them together to calculate more sophisticated metrics like CLV. This approach keeps your code DRY (Don’t Repeat Yourself) and makes the whole analytics project infinitely easier to manage and debug down the line.
Turning Your Data Into Action-Ready Insights

It’s a great feeling to finally nail down your customer success KPIs with total precision. But let’s be honest, the numbers themselves don’t save accounts. The real magic happens when you get these insights into the hands of the people who can actually do something with them—your customer success managers. A perfectly calculated NRR sitting in a data warehouse isn’t helping anyone.
This brings us to the final, and most critical, step: activating your data. It’s all about building a bridge between your shiny new data stack and the day-to-day tools your CS team practically lives in. We need to take these metrics off the dashboard and turn them into proactive, operational triggers.
First, Establish a Single Source of Truth
Before you can push data out to your teams, everyone has to agree on what the numbers actually mean. Sound familiar? How many meetings have you sat in where the sales team’s churn number is completely different from the one finance is reporting? This chaos is a classic symptom of metrics being defined in a dozen different spreadsheets, reports, and BI dashboards.
A semantic layer—often called a metric layer—is the permanent fix for this. By defining every single KPI centrally in a tool like dbt, you create one, version-controlled source of truth for the entire company.
A metric layer guarantees that whether someone is looking at a Salesforce dashboard, a Tableau report, or a Google Sheet, the definition for “Net Revenue Retention” is identical because it pulls from the exact same, centrally-managed logic. This puts an end to data debates and lets you focus on strategy.
In this world, your nrr_kpi model in dbt becomes the undisputed law of the land. Any tool that needs to show NRR simply queries that model. No more rogue calculations or shadow spreadsheets.
From the Warehouse to the Front Lines
Okay, so you’ve got a trusted set of KPIs. Now what? The goal is to get them out of the warehouse and into the operational systems your team uses every single day. Expecting a CSM to log into a BI tool, hunt down the right dashboard, and interpret a chart is a fundamentally reactive process. Proactive customer success means putting the data where the work is already happening.
This is where the power of Reverse ETL comes in. Instead of only pulling data into your warehouse (the “ETL” part), Reverse ETL tools push your clean, transformed data back out to your business applications. It’s the crucial last mile of your data pipeline that makes your analytics truly operational.
Just imagine a CSM logging into Salesforce and seeing a field on an account record that says Customer Health Score: 42 (Red), updated just an hour ago from your data warehouse. That’s the kind of power we’re talking about.
Practical Reverse ETL Use Cases for Customer Success
So what does this actually look like in practice? It’s all about turning your data into automated alerts and rich, contextual information for your team.
Here are a few high-impact examples I’ve seen work wonders:
- At-Risk Account Alerts: When a customer’s health score (calculated in Snowflake) dips below a set threshold, a Reverse ETL pipeline can automatically create a high-priority task in Salesforce. It’s assigned directly to the account owner, and the task description can even include the why behind the score drop, like “product usage down 30%” or “2 open high-priority support tickets.”
- Surfacing Expansion Opportunities: You can easily identify customers who have high product adoption but aren’t on your top pricing tier. This “Product Qualified Lead” (PQL) status gets synced to a custom field in your CRM, instantly flagging the account for the CSM to explore an upsell or cross-sell conversation.
- Enriching Customer Profiles: Push your key metrics directly onto the Salesforce Account object. When a CSM is prepping for a quarterly business review, they can see the account’s NRR, key feature adoption rates, and CLV right on the page they use all day, without ever having to switch tabs or log into another system.
This operational loop—from data warehouse back to business app—is what transforms your customer success team from reactive firefighters to proactive advisors. They’re no longer hunting for information; the information finds them, right when they need it most. This is how you make sure your big investment in data and KPIs actually pays off.
How to Maintain and Govern Your CS KPIs
Building a solid set of customer success KPIs is a massive achievement, but don’t pop the champagne just yet. The real work is just beginning. Great analytics aren’t a “set it and forget it” project; they’re a living system that needs constant care to stay trustworthy.
Without proper maintenance and governance, even the most carefully crafted metrics will slowly drift into irrelevance or, even worse, become flat-out misleading. Data pipelines break, business logic changes, and new, weird edge cases always find a way to pop up. The real challenge is making sure your KPIs are just as reliable in year three as they were on day one.
Ultimately, this is all about building trust. When your exec team pulls up a churn report, they need to have absolute confidence in those numbers. That confidence is earned through diligent monitoring, clear ownership, and a proactive plan for tackling the messy realities of a growing business.
Establishing Clear Ownership
One of the fastest ways for a KPI system to fall apart is through fuzzy ownership. If everyone is responsible, nobody is. When a number looks off or a data pipeline fails, you need one person who is accountable for digging in and fixing it.
This responsibility should be formally documented and split between two critical roles:
- Metric Owner: This is usually a business leader, like the Head of Customer Success. They own the definition of the KPI. They are the final word on what “churn” actually means and what logic goes into the calculation.
- Data Owner: This is your data or analytics engineer. They own the technical implementation and the data pipeline that feeds the KPI. Their world is the health, accuracy, and timeliness of the data itself.
This separation of duties creates a fantastic partnership. The business defines what success looks like, and the data team gets to build a rock-solid technical foundation to measure it.
When a key metric like Net Revenue Retention suddenly looks weird, the process is clear. The Metric Owner gets an alert and loops in the Data Owner to figure out if it’s a real business trend or a data quality bug. This simple setup prevents chaotic, all-hands-on-deck fire drills.
Monitoring and Observability
You can’t fix what you can’t see. That’s why active monitoring is non-negotiable for keeping your CS KPIs healthy. Just hoping someone will spot an anomaly in a dashboard is a recipe for disaster. By the time they do, bad data might have already been used to make critical decisions.
This is where the discipline of data observability comes into play. It’s all about automatically keeping an eye on your data pipelines for issues with freshness, volume, distribution, and schema changes. You can get a great primer on the core ideas by checking out this guide on what is data observability.
Effective monitoring means setting up automated alerts for things like:
- A sudden, unexplained drop in the row count of your
subscriptionstable. - The
mrrfield from Salesforce suddenly showing up with NULL values. - A dbt model failing to run on schedule, making all your KPI data stale.
These alerts are your early-warning system. They give your data team a chance to jump on problems long before they ever reach the business stakeholders who depend on those numbers.
Navigating Common Edge Cases
As your business grows, your data gets messier. It’s inevitable. The simple KPI calculations that worked for your first 100 customers will start to crumble as you add new pricing models, complex account structures, and unique billing situations.
Here are a couple of tricky scenarios you’re almost guaranteed to face:
- Parent-Child Account Hierarchies: How do you calculate churn for a massive enterprise customer with 20 different child accounts? Do you roll everything up to the parent? What if one child account churns but the others expand? Your KPI logic needs a clear, consistent rule for handling these hierarchies.
- Usage-Based Pricing: For customers on a pay-as-you-go plan, MRR can be all over the place. Calculating retention for these accounts is a totally different ballgame than it is for fixed subscriptions. You might need to average their revenue over a longer timeframe or even segment them out into their own cohort.
The secret is to anticipate these complexities and build the logic directly into your dbt models from the start. Hardcoding assumptions or dealing with these cases manually in a spreadsheet is a surefire way to end up with inconsistent, untrustworthy metrics.
Getting Your Customer Success KPIs Right in the Real World
Even with perfect SQL and a pristine data model, the real world always throws a few curveballs. Once you start rolling out these KPIs, you’ll inevitably run into questions from the team. Let’s tackle some of the most common ones I hear.
Getting these details sorted is what separates a KPI program that actually helps your team get ahead of problems from one that just adds more clutter to your dashboards.
What’s the Deal with Leading vs. Lagging KPIs?
This one trips people up all the time, but it’s pretty simple. One looks forward, the other looks back.
- Lagging KPIs are your report card. They tell you what already happened. Think Net Revenue Retention (NRR) or Customer Churn Rate. They’re essential for judging past performance, but you can’t change them once they’re in the books.
- Leading KPIs are your crystal ball. They give you a hint about what’s likely to happen. Customer Health Scores, Product Adoption Rates, and how often a customer logs in are all great examples. They’re your early warning system.
You absolutely need a mix of both. Lagging KPIs prove your strategy is working (or not). Leading KPIs give your team a chance to step in and influence the future before it shows up as a bad number on that report card.
How Often Should We Actually Check This Stuff?
The answer is: it depends entirely on what you’re trying to do with the number. Pumping every single metric into a real-time feed is overkill and just creates noise.
For the big, revenue-focused metrics like NRR and Gross Revenue Retention, looking at them monthly or quarterly is usually the right cadence. These are slow-moving ships that reflect broader trends.
But for your leading indicators? Things like Customer Health Scores or engagement metrics need a much faster pulse. You want those updated in near real-time, or at the very least, daily or weekly. This is what allows a Customer Success Manager (CSM) to spot a wobble and react before it turns into a churn risk.
Your exec-level dashboards can stick to monthly and quarterly views. But the dashboards your CSMs are living in day-to-day need fresh, granular data to be of any real use.
We’re Just Starting Out. Which Three KPIs Matter Most?
If you’re new to this, don’t boil the ocean. You’ll get overwhelmed and end up with a bunch of metrics nobody looks at. Start simple and focus on impact.
For any company just getting its CS function off the ground, I always point them to these three to start:
- Customer Churn Rate (Logo Churn): It’s the most fundamental question: are we keeping the customers we fought so hard to win? It doesn’t get more basic than this.
- Net Revenue Retention (NRR): This is the powerhouse metric. It tells you if your existing customers are becoming a growth engine or a leaky bucket. A strong NRR is a massive signal of product-market fit and the value you’re delivering.
- Customer Satisfaction (CSAT) or NPS: Don’t get lost in just the numbers. Early on, this qualitative feedback is pure gold. It gives you the “why” behind the what and helps you fix the root causes of frustration before they lead to churn.
Building and maintaining these data pipelines requires a specific kind of engineering skill. RevOps JET provides technical revenue operations engineering on demand, writing production-grade code to build reliable data pipelines and scalable CRM structures. Find out how we can save you 300+ engineering hours per year by visiting our website.