Before you even think about writing a single line of SQL, remember this: a great database schema starts with conversations, not code. It’s all about translating what the business actually needs into a blueprint that defines how your data is organized, stored, and connected.
Your Blueprint for a High-Impact Database Schema

Your journey to an amazing schema doesn’t start in a code editor; it starts at a whiteboard with your stakeholders. For anyone in revenue operations or analytics, this means getting in a room with the sales, marketing, and success teams to truly understand their world. Your mission is to turn their goals and headaches into a concrete set of data requirements.
When someone says, “we need a better view of the pipeline,” that’s your cue to dig deeper. What specific questions are they trying to answer? Are they struggling to track lead source decay? Do they need to measure MQL-to-close velocity? Or is it all about finally cracking multi-touch attribution? Each question hints at the specific data entities and relationships you’ll need to build.
From Whiteboard to Physical Model
This initial discovery work is what shapes your conceptual model. Think of this as a high-level, non-technical drawing that identifies the core business concepts and how they relate to one another. For a RevOps team, this usually boils down to your bread-and-butter entities:
- Accounts: The companies you sell to.
- Contacts: The people at those companies.
- Opportunities: The deals in your pipeline.
- Subscriptions: The recurring revenue contracts you’ve closed.
- Users: Your internal sales and customer success reps.
Just getting everyone to agree on this simple map is a massive win. It forces alignment on business logic before you get bogged down in technical details and helps you build a shared language.
From there, you can move on to designing the physical model. This is where the rubber meets the road. You’ll define the actual tables, columns, data types, and the keys that stitch everything together. For instance, your opportunities table will absolutely need a foreign key, like account_id, that links back to the accounts table.
A well-designed schema is the foundation for everything that follows. It prevents the kind of painful rework that grinds data teams to a halt and ensures your schema can support the reliable, automated data pipelines that modern RevOps teams depend on.
The Importance of a Solid Foundation
I can’t stress this enough: getting this foundational blueprint right is non-negotiable. A flawed schema creates a mountain of technical debt that only gets bigger over time. It’s the root cause of slow queries, inaccurate reports, and fragile data pipelines that shatter every time a source system is updated.
On the flip side, a thoughtful design makes life easier for everyone. It simplifies the SQL your analysts have to write, provides a stable structure for your dbt models, and lets your BI tools deliver fast, trustworthy insights. This upfront investment in understanding the business and translating it into a logical structure is what separates a brittle data setup from a scalable, high-impact one. This initial phase of learning how to design a database schema is without a doubt the most critical step.
Choosing Between Normalization and Denormalization
When you’re designing a database, one of the first big questions you’ll face is a classic trade-off: do you build for data integrity or for lightning-fast queries? This isn’t just theory; it’s a decision that will directly shape how your operational systems and analytics platforms perform. The two schools of thought here are normalization and denormalization.
Your choice really boils down to the job at hand. A schema for a transactional system like Salesforce, where data is constantly being written and updated, has totally different requirements than a data warehouse like Snowflake, where analysts are running massive, complex queries to find insights.
The Case for Normalization
Normalization is all about one thing: eliminating data redundancy. The philosophy is simple and powerful—every piece of information should live in exactly one place. This creates that “single source of truth” we’re always chasing, which is absolutely essential for systems where accuracy is king.
Think about your customer data. In a properly normalized schema, you’d have a customers table holding the unique customer_id and their details. When they place an order, that record goes into a separate orders table, linked back only by the customer_id.
Why bother? Because it prevents what we call update anomalies. If a customer moves and updates their shipping address, you change it in one row in the customers table. Done. If that address were copied into every single order they ever placed, you’d have a nightmare on your hands, trying to update hundreds of records and inevitably missing some. That’s how you get corrupted data.
For the transactional systems that run your daily business, normalization is the only way to go. It builds data integrity right into the foundation of your schema, keeping your operational data clean and reliable.
The Power of Denormalization for Analytics
So, normalization is fantastic for writing clean data, but it can make reading that data a bit more work. To get a full picture of a customer’s order history, you have to JOIN the customers and orders tables. That’s no big deal for a quick lookup. But what happens when an analyst needs to join five, ten, or even more tables for a complex report? Performance can absolutely tank.
This is where denormalization shines. It’s the art of strategically adding redundant data back into your schema specifically to make queries faster. In a data warehouse, you’ll often create wide, flat tables designed for analytics that pre-join all the useful information together.
You might end up with a table that looks something like this:
| order_id | order_date | customer_id | customer_name | customer_address | product_sku | revenue |
|---|---|---|---|---|---|---|
| 101 | 2024-10-26 | 5432 | Acme Corp | 123 Main St | WIDGET-A | 1500.00 |
| 102 | 2024-10-26 | 9876 | Globex Inc | 456 Oak Ave | WIDGET-B | 2500.00 |
This kind of structure is a dream for BI tools. Need a report on revenue by customer address? No joins needed. The tool just scans the table. It’s the secret to building snappy dashboards for things like revenue forecasting and performance analysis. Our guide on SQL query optimization techniques gets into the weeds on how schema design like this impacts query performance.
We’ve moved past the days of rigid, monolithic schemas that would break data pipelines at the slightest change. Today’s modern data lakehouse architectures, which most large companies now use, fully embrace this hybrid model. They give you the structure of a warehouse with the flexibility of a data lake, cutting down on storage costs and giving RevOps teams the power they need. As some great data management trends from DATAVERSITY have shown, this evolution is here to stay.
Ultimately, you won’t choose one or the other. You’ll use both: normalization for your source systems and denormalization for your analytics warehouse.
4. Building for Analytics with a Star Schema
When your stakeholders need fast, intuitive answers from the data, the highly normalized schemas that run your transactional systems just can’t keep up. They’re built for rock-solid data integrity, not for analytical speed. This is exactly where a different design philosophy becomes your secret weapon for powerful analytics.
For anyone in RevOps, the real goal is to get business users to explore data themselves. You don’t want every request for a report to turn into another ticket for an analyst to write a gnarly, multi-join SQL query.
The solution? The star schema. It’s the undisputed champion for analytics and business intelligence, and for good reason.
This diagram really clarifies the fundamental choice you have in schema design. You can go down the path optimized for transactions (Normalization) or the one built for analytics (Denormalization), which is where star schemas live.
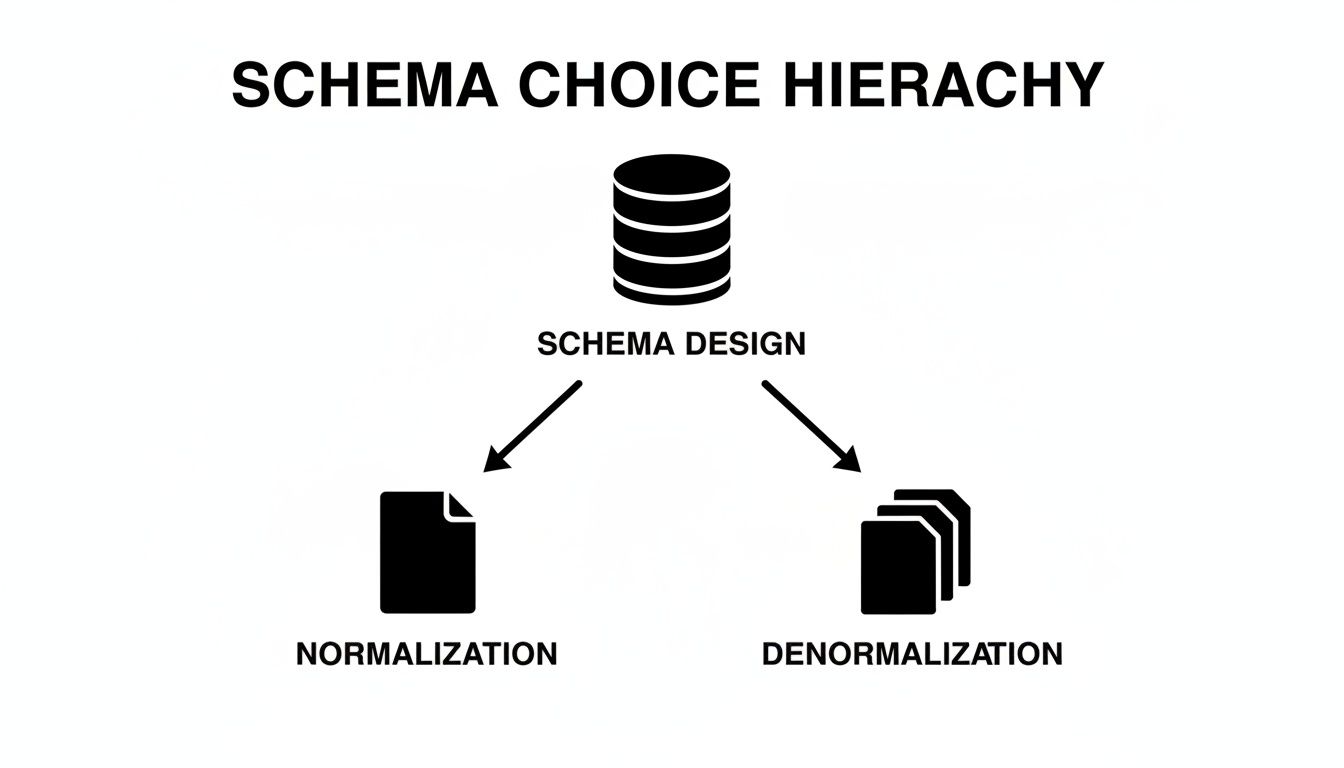
It’s a perfect illustration of how the right path depends entirely on the job to be done—one prioritizes data integrity, the other prioritizes raw query performance.
Understanding Facts and Dimensions
The star schema gets its name from its shape: a central table connected to several others, looking like a star. It’s a beautifully simple concept built on just two types of tables.
-
Fact Tables: These are the heart of your schema. They hold the “facts” of your business—the numbers, metrics, and key performance indicators you need to measure. Think
revenue_amount,deals_closed_count, ormarketing_qualified_leads. Fact tables are all about the events and measurements. -
Dimension Tables: These tables give you the context—the “who, what,where, when, and why” behind the facts. They’re packed with the descriptive, categorical attributes you’ll use to slice and dice your data, like
sales_rep_name,product_category,account_industry, ormarketing_campaign_name.
By neatly separating your core metrics from all their descriptive context, the star schema makes data exploration incredibly intuitive for everyone involved.
A Practical RevOps Star Schema Example
Let’s imagine we’re designing a schema for pipeline analysis. Instead of trying to wrangle a dozen different tables from a raw Salesforce replica, we can build a focused star schema. The centerpiece would be a fact table, maybe called fct_opportunity_snapshots.
This table would capture a daily snapshot of every single opportunity, holding key metrics like amount, is_closed_won, and days_in_stage. This central fact table is then surrounded by its dimensions:
dim_accounts: All the descriptive info about a customer, such asaccount_name,industry,employee_count, andsales_territory.dim_users: Details about sales reps, like theiruser_name,team, andmanager.dim_products: Describes what’s being sold, with fields likeproduct_nameandproduct_family.dim_date: A dedicated table with columns forfull_date,day_of_week,month,quarter, andyear. Seriously, this is a non-negotiable best practice that makes any time-based analysis a breeze.
Here’s a quick breakdown of how these pieces fit together for our ‘Opportunity Pipeline’ analysis.
Star Schema Components for RevOps
| Table Type | Example Table Name | Contains | Purpose |
|---|---|---|---|
| Fact | fct_opportunity_snapshots | amount, is_closed_won | Stores the numerical, measurable events about the sales pipeline. |
| Dimension | dim_accounts | account_name, industry | Provides the descriptive context about the customer accounts. |
| Dimension | dim_users | user_name, team | Describes the sales reps and their team structure. |
| Dimension | dim_products | product_name, family | Contains details about the products being sold. |
| Dimension | dim_date | full_date, quarter, year | Allows for easy slicing and dicing of facts by time periods. |
With a structure like this, a question like “Show me the total pipeline amount by sales territory for last quarter” becomes a simple query. The BI tool just needs to join fct_opportunity_snapshots to dim_accounts and dim_date. The clarity this brings to your data flows is a game-changer, a topic we explore more deeply in our post on building a complete data pipeline architecture diagram.
Handling Historical Changes with SCDs
So, what happens when an account gets reassigned to a new sales territory? If you just update the sales_territory field in your dim_accounts table, you’ve instantly destroyed your historical accuracy. All past revenue from that account will now look like it belongs to the new territory. Big problem.
This is a classic data warehousing challenge solved by Slowly Changing Dimensions (SCDs). A very common and effective approach, SCD Type 2, involves adding new rows to track this history. Instead of just overwriting the record, you would:
- Expire the old record by setting an
end_datecolumn to the current date. - Create a new record for the same account with the updated
sales_territoryand a newstart_date.
By using SCDs, your star schema can accurately answer historical questions like, “What was our pipeline in the West territory last year?” even if your territories have been completely reorganized since then. This historical integrity is absolutely critical for trustworthy RevOps reporting.
Future-Proofing Your Schema with Smart Conventions
A brilliant schema design can quickly unravel without the small, practical details that make it resilient and easy for people to actually use. These conventions are the guardrails that prevent your data warehouse from spiraling into a confusing mess. They’re all about establishing consistency, clarity, and a solid plan for handling the one constant in our world: change.
Getting this right from the start means building a schema that can evolve with the business, not one that shatters the moment someone adds a new field in Salesforce.
Keys and Naming: The Unsung Heroes
At the heart of every table are its keys—the columns that enforce relationships and guarantee your data makes sense. You’ll run into three main types:
- Primary Keys: The unique identifier for each row in a table, like
account_id. No duplicates allowed here. - Foreign Keys: A primary key from another table that links them together. Think of the
account_idcolumn sitting in youropportunitiestable. - Surrogate Keys: A unique, system-generated ID (usually an auto-incrementing number or a UUID) that has zero business meaning.
For analytical warehouses, surrogate keys are an absolute lifesaver. You might be tempted to use a Salesforce record ID as a primary key, but those can actually change during system merges or data restores. A stable, internally-generated surrogate key insulates your warehouse from that kind of chaos in the source system.
Just as critical is a simple, consistent naming convention. This isn’t just about being fussy; it’s about making your schema instantly understandable to anyone who looks at it. A great, no-fuss starting point is:
- Use
snake_casefor all tables and columns (opportunity_amountnotOpportunityAmount). It’s the standard for a reason. - Keep table names plural (
accounts,users) and column names singular. - Use logical prefixes for different table types, like
fct_for fact tables anddim_for dimensions when you’re building a star schema.
This simple framework makes your dbt models far more readable and helps you sidestep the kind of messy schema that quietly racks up technical debt. If you’re wrestling with keeping your data infrastructure clean, check out our guide on how to reduce technical debt in your systems.
Taming the Inevitable: Schema Drift
Schema drift is what happens when a source system’s structure changes without telling you. A RevOps analyst adds a new custom field to the Opportunity object in Salesforce, and bam—your nightly data pipeline breaks because the destination table in Snowflake doesn’t have a place for it.
You can’t stop schema drift, but you can absolutely plan for it. The goal is to build a system that gracefully handles unexpected changes from sources like Salesforce without bringing your entire analytics stack to a grinding halt.
A solid strategy here involves a mix of smart tooling and clear processes. Many modern data ingestion tools can detect and handle schema drift automatically. You can often configure them to add new columns to the target table on the fly or shunt records with weird structures into a quarantine area for you to review later.
This proactive approach is becoming non-negotiable as businesses grow. We’re seeing a huge trend toward decentralizing data ownership to domain teams—a core idea behind the data mesh concept. This is a game-changer for Sales and Marketing Ops leaders who need to sync CRM data with Snowflake. In fact, a comprehensive outlook on database trends found that 80% of enterprises now use a mix of different schema types, with data mesh adoption surging 45% year-over-year as companies try to escape the bottlenecks of old, centralized models. You can dive deeper into the future of database design on rapydo.io.
By thinking ahead about conventions and preparing for drift, you’re not just designing a database—you’re building a data asset that can last.
Making Your Schema Usable and Maintainable

Let’s be honest: a technically perfect schema is completely useless if your team can’t understand it, trust it, or maintain it. This is where we stop talking theory and start getting practical, turning that brilliant design into a living, breathing asset the business can actually rely on.
Without solid documentation and processes, even the most elegant schema will eventually become a mysterious black box that everyone’s too scared to touch.
The real goal here is to build something that’s not just powerful but also approachable. It’s about creating a sustainable data culture where changes are transparent, quality is a given, and troubleshooting isn’t a five-alarm fire. We’ll get there by focusing on three key practices: treating documentation like code, having a smart testing strategy, and building operational runbooks.
Embrace Documentation as Code
Forget about those stale Confluence pages or spreadsheets that are out of date the second you hit “save.” The only way to keep documentation useful is to treat it like code. This means your data dictionary, entity-relationship diagrams (ERDs), and metric definitions live right inside the same Git repository as your dbt models and transformation logic.
When you treat your documentation this way, you get all the awesome benefits of version control. Someone adds a new column or tweaks a business definition? That update gets committed, reviewed in a pull request, and merged right alongside the code that makes it happen.
This workflow creates a single, version-controlled source of truth that people can finally trust.
- dbt Docs: If you’re already using dbt, you have a powerhouse tool waiting for you. Just by adding descriptions to your models and columns in their YAML files, you can spin up a complete, searchable, and interactive documentation site with a single command. It’s a game-changer.
- ERD Generation: You can use tools to automatically generate ERDs from your database schema. Just check the diagram image into your repository. This visual map of your data is invaluable for getting new hires up to speed or explaining complex relationships to stakeholders.
This documentation-as-code approach is what separates professional data teams from amateur ones. It ensures that your schema knowledge isn’t just stuck in one person’s head but is a shared, evolving asset for the entire organization.
Implement a Pragmatic Testing Strategy
A schema without tests is a schema you can’t trust. Period. Automated testing is your safety net, giving you the confidence to make changes and evolve your design without worrying about some silent, downstream failure blowing up a critical dashboard.
You don’t need an overly complicated strategy to start; you just need to be consistent.
Begin with the simple, out-of-the-box data tests that tools like dbt provide. They are incredibly easy to set up and will catch a surprisingly high percentage of common data quality problems.
- Uniqueness Tests: Make sure your primary keys, like
order_idoruser_id, have no duplicates. This is data integrity 101. - Not-Null Tests: Verify that critical columns are never empty. An
order_dateor atransaction_amountsimply must have a value. - Accepted Values Tests: If a column should only contain specific values (e.g., an order status of ‘shipped’, ‘pending’, or ‘cancelled’), a test can enforce that rule and catch bad data immediately.
- Relationship Tests: Think of these as integration tests for your schema. They check that every foreign key in one table (like
account_idin youropportunitiestable) actually exists in the parent table (accounts). This prevents orphaned records and guarantees your joins won’t silently drop data.
Setting up these tests is the first step toward building a resilient data pipeline. They act as a contract, guaranteeing that the data flowing through your schema meets the business rules you’ve laid out.
Create Living Operational Runbooks
Finally, you need a plan for when things go wrong—because they absolutely will. An operational runbook is a living document that guides your team through common tasks, troubleshooting steps, and incident response. This isn’t a document you write once and forget about; it’s a playbook that you update constantly with lessons from real-world events.
Keep your runbooks in your Git repo, right alongside your code and documentation. A good runbook includes crystal-clear, step-by-step instructions for things like:
- Handling a Schema Migration: What are the exact steps to safely add a new column to a production table? Who needs to be notified? Is there a specific order of operations?
- Troubleshooting a Pipeline Failure: If a dbt model fails, what are the first three things to check? How do you trace the problem back to its root cause?
- Responding to a Data Quality Alert: When a test fails, what’s the official process for investigating the issue and letting business stakeholders know?
These practices—documentation, testing, and runbooks—are what truly bring your schema to life. They are the operational disciplines that transform a good design into a great, scalable, and trustworthy data asset that your company can build on for years to come.
Got Questions About Database Schema Design? You’re Not Alone.
When you’re building a database schema for something as critical as revenue operations, a lot of questions pop up. These aren’t just academic exercises—the answers can mean the difference between a data model that empowers your team and one that just creates headaches.
Let’s walk through some of the most common questions I hear from teams in the trenches.
How Often Should I Be Updating My Database Schema?
There’s no magic number here. The real answer is: your schema should evolve when your business evolves. Trying to stick to a rigid update schedule is a recipe for disaster.
Think of it this way: minor, additive changes are just part of the normal rhythm of business. You’ll likely see these pop up quarterly as new fields get added to Salesforce or marketing adds a new tracking parameter. These are small, manageable tweaks.
Major overhauls are a different beast entirely. These should be rare and handled with extreme care. You’d only undertake a big redesign in response to a seismic business shift, like:
- Launching a brand new product line with a totally different sales process.
- Pivoting your entire go-to-market strategy.
- Acquiring another company and needing to merge its entire data world with yours.
The frequency of change isn’t what matters. What truly matters is how you manage that change. A solid process with clear communication, thorough testing, and good documentation will keep a small update from turning into a full-blown crisis. Without a plan, even the tiniest change can cause chaos.
What’s the Biggest Mistake People Make in RevOps Schema Design?
Easy. The single most damaging mistake is designing in a vacuum. I’ve seen beautifully engineered schemas that are technically perfect but utterly useless because they don’t answer the questions the business is actually asking.
This happens when data teams get so caught up in normalization rules and indexing strategies that they forget to talk to the people who will actually use the data. If you haven’t sat down with the heads of sales, marketing, and success, you’re flying blind.
You have to start with the stakeholders. Ask them real, pointed questions:
- “If you had a magic wand and perfect data, what’s the one decision you would make today?”
- “Which report do you waste hours pulling together in a spreadsheet every single week?”
- “What’s the one blind spot you have about our customer lifecycle that keeps you up at night?”
Their answers are your blueprint. A schema built from that foundation isn’t just a technical asset; it’s a tool built to solve real-world business problems.
Star Schema or Snowflake Schema: Which One Should I Use?
For 99% of RevOps and business analytics use cases, the choice is clear: start with a star schema. It’s the workhorse for a reason. Its simple structure—a central fact table surrounded by dimension tables—is powerful, fast, and easy for people to understand.
Think of it: your business users need to slice and dice data. A star schema is built for exactly that. Analysts can write cleaner SQL, and your BI tools will run circles around a more complex model. The simplicity is a feature, not a bug.
A snowflake schema, on the other hand, takes normalization a step further, breaking dimension tables into even smaller sub-tables. For example, your dim_product table might be “snowflaked” out into product_category and product_brand tables. While this might save a tiny bit of storage, it forces more joins, which almost always slows your queries down.
The only time you should even consider a snowflake schema is if a single dimension table has grown absolutely massive—I’m talking millions and millions of rows—and is causing legitimate performance or cost issues. For most RevOps teams, that’s an edge case you may never encounter. Stick with the star.
At RevOps JET, we build the production-grade schemas and data pipelines that high-growth companies rely on. If you need real engineering to sync Salesforce to Snowflake, build resilient dbt models, and eliminate technical debt without the cost of a full-time hire, see how we can help. Learn more about our on-demand engineering service at https://revopsjet.com.