Data-driven marketing isn’t about fancy software or complicated dashboards. At its core, it’s about making smart decisions based on what your customers are actually doing, not what you think they’re doing. Instead of throwing spaghetti at the wall to see what sticks, you’re using real insights to create campaigns that are targeted, personal, and genuinely effective.
It’s all about turning information into action.
What Are Data-Driven Marketing Solutions
Think about a chef trying to bake a world-class cake. One chef just wings it, tossing in a “bit of this” and a “pinch of that.” The other follows a precise, tested recipe, measuring everything down to the gram. You can probably guess which chef’s cake will be consistently delicious.
That’s the fundamental difference between old-school marketing and a modern, data-driven approach.
From Guesswork to Predictable Growth
For too long, marketing felt like guesswork. You’d launch a big campaign, cross your fingers, and hope it connected with the right people. Data-driven marketing solutions change the game entirely. They act like a GPS for your business, giving you a clear, fact-based roadmap to engage your customers.
It’s about creating a continuous feedback loop. You collect information from every customer touchpoint—from your website to your sales calls—analyze it to see what’s resonating, and then use those insights to make your next move even better. This isn’t a one-off project; it’s a complete operational shift that builds a predictable engine for growth.
When you get this right, the benefits are huge:
- You actually understand your customers: You can pinpoint who your best customers are, what they truly want, and how they behave across their entire journey.
- Personalization that works: You can finally deliver the right message to the right person at the right time, making your marketing feel helpful instead of intrusive.
- Better ROI, less waste: By focusing your time and budget on what’s proven to work, you stop wasting money and maximize the return on every single dollar you spend.
To put it in perspective, let’s look at how these two approaches stack up.
Traditional vs Data-Driven Marketing Approaches
The table below breaks down the fundamental differences between the two mindsets. One is reactive and based on assumptions, while the other is proactive and built on evidence.
| Aspect | Traditional Marketing (Guesswork) | Data-Driven Marketing (Insight) |
|---|---|---|
| Strategy | Based on intuition, past experience, and broad assumptions. | Based on customer data, behavior patterns, and predictive analytics. |
| Targeting | Broad demographic segments (e.g., “women 25-40”). | Highly specific micro-segments and individual behaviors. |
| Personalization | Generic messaging for large groups. | 1:1 personalization based on individual history and actions. |
| Decision Making | Gut feelings and subjective opinions. | A/B testing, statistical analysis, and hard data. |
| Measurement | Relies on vanity metrics like impressions or clicks. | Focuses on revenue-centric KPIs like LTV, CAC, and ROI. |
| Optimization | Campaigns are reviewed and adjusted infrequently. | Campaigns are continuously monitored and optimized in real-time. |
Ultimately, a data-driven approach allows you to build a system for growth, not just a series of one-off campaigns.
The Financial Impact of Data-Informed Decisions
This shift isn’t just a passing trend; it’s a massive economic force. The global big data analytics market, which powers these solutions, was valued at $32.30 billion in 2021. That number is projected to explode to $924.39 billion by 2032.
The numbers don’t lie. Companies that truly embrace data-driven practices see an ROI that is five to eight times higher than those who don’t. This confirms what many of us have known for a while: data is the most valuable asset a modern marketing team can have. Find more data on data-driven marketing ROI on designveloper.com.
By connecting every piece of customer information—from website visits and email opens to sales calls and product usage—you build a complete, 360-degree view. This unified picture is what empowers you to build stronger relationships, reduce churn, and drive real, sustainable growth for your business.
The Core Components of a Data-Driven Engine
To really get what data-driven marketing is all about, you have to pop the hood and see how the engine works. It might seem intimidatingly complex from the outside, but the process itself is surprisingly logical. Think of it like a state-of-the-art logistics network built to deliver the perfect message to the right person, every single time.
This powerful engine is built on five core parts, all working in harmony to turn raw information into actual revenue. Each step builds on the one before it, taking messy data points and forging them into clear, actionable marketing campaigns.
The journey from scattered data to measurable growth follows a well-defined path, which you can see in the diagram below.
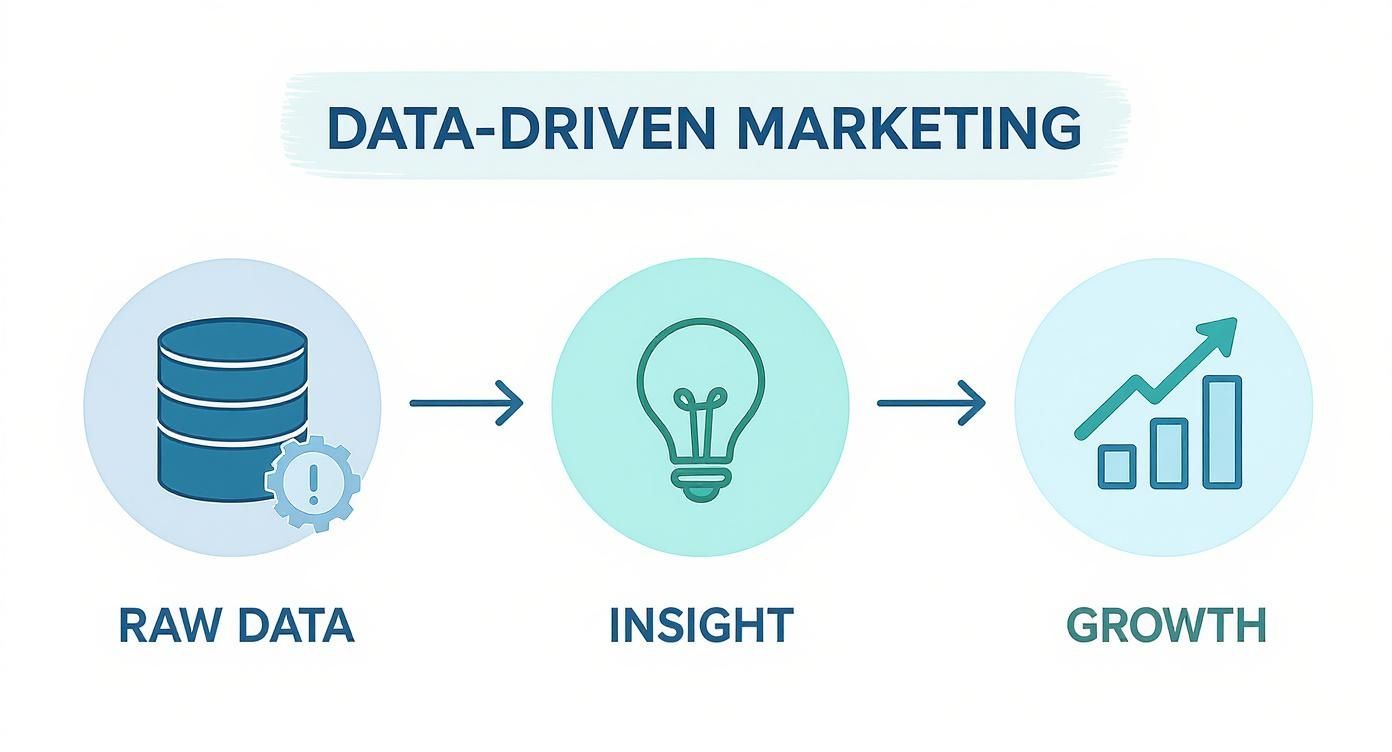
This process shows how we refine raw data into powerful insights, which in turn fuel real business growth and let us fine-tune our strategy.
1. Data Collection and Ingestion
This is where it all starts. If we stick with our logistics analogy, this is the part where mail carriers collect letters from every single mailbox in the city. Your “mailboxes” are all the different places where customers interact with your business. The goal is to gather data from every source imaginable to build a complete 360-degree view.
This means pulling in information from:
- Website Analytics: Who’s visiting your site, what are they clicking on, and how long do they stick around?
- CRM Data: What’s happening in sales calls, where are deals in the pipeline, and what do we know about the account in a CRM like Salesforce?
- Product Usage: How are people actually using your software? Which features are they adopting?
- Marketing Automation: Who’s opening your emails, clicking on links, and engaging with your campaigns?
You can’t afford to miss anything. A staggering 87% of marketers say that data is their most under-used asset, usually because it’s stuck in a dozen different systems that don’t talk to each other. Proper data ingestion pulls it all together.
2. The Central Data Warehouse
Once all that “mail” is collected, it gets sent to a central sorting facility. This is your data warehouse—think platforms like Snowflake or Google BigQuery. A data warehouse is much more than just storage; it’s a specialized database designed to handle huge amounts of data from all those different sources. It becomes your single source of truth for every customer interaction.
A data warehouse isn’t a dusty storage closet; it’s an organized, searchable library. It’s where you can analyze years of historical data right alongside what’s happening in real-time, laying the groundwork for every insight you’ll uncover later.
Without this central hub, your data stays siloed. That makes it almost impossible to connect the dots between, say, a click on a marketing email and a pivotal sales call that happened three weeks later.
3. Data Transformation
Back at the sorting facility, the raw mail needs to be processed. Addresses get standardized, letters are sorted, and packages are routed. In the data world, we call this data transformation. Raw data is almost always messy, full of inconsistencies, and pretty much useless on its own. The transformation stage is where we clean, structure, and enrich it.
This is where the magic happens. We’re:
- Cleaning: Fixing typos like “Californya” and turning it into “California.”
- Standardizing: Making sure all revenue numbers are in USD and follow the same format.
- Enriching: Adding crucial context to a lead, like their company’s size or industry. Our guide on B2B data enrichment strategies dives much deeper into how you can layer this kind of valuable information onto your existing data.
This step is what turns raw, unreliable material into a trustworthy, refined asset that’s ready for analysis.
4. Analytics and Insights
Now that your data is clean and organized, you get to play detective. This is the analytics phase, where you dig into the information to figure out what’s happening, why it’s happening, and what you should do about it. It’s where you finally connect marketing activities directly to business outcomes.
You can start answering the really big questions, like:
- Which marketing channels bring in our most profitable customers?
- What specific user behaviors tell us an account might be about to churn?
- What’s the true lifetime value (LTV) of customers we acquired through our LinkedIn ads versus our content marketing?
This is where the “aha!” moments happen. You uncover hidden patterns, test your assumptions, and find the real story your data is trying to tell you.
5. Activation and Reverse ETL
Finally, it’s delivery time. Activation is all about putting your hard-won insights into action. It means pushing the right data back into the tools your sales, marketing, and success teams live in every day. The key piece of tech here is Reverse ETL, which acts as a bridge, syncing enriched data from your warehouse back to your CRM, marketing platform, or ad networks.
For example, a “product-qualified lead” score calculated in the warehouse can be sent straight to Salesforce. This instantly alerts a sales rep that a specific account is showing all the right signs and is ready for an upsell conversation. This is what it means to close the loop—turning a behind-the-scenes insight into a real-world action that drives revenue.
Building Your Data-Driven Marketing Architecture

Knowing the different parts of a data-driven engine is one thing. Actually putting them together into a system that works is a whole different ballgame. As you lay the groundwork, you’ll face a major decision that will define what you can (and can’t) do for years.
It all comes down to two different ways of thinking. Think of it like buying a computer. Are you looking for a pre-built machine that works perfectly right out of the box? Or do you want to build a custom rig from scratch, hand-picking every component for maximum power and flexibility?
This is the fundamental difference between an all-in-one suite and a composable stack. Neither one is automatically better—the right answer depends on your team’s needs, your resources, and where you’re headed.
The All-in-One Suite: The Pre-Built Approach
An all-in-one suite is your plug-and-play solution. Platforms like HubSpot are a great example, bundling marketing automation, CRM, analytics, and content tools into a single, cohesive package. The biggest draw here is sheer convenience. Everything is built to work together from the get-go, which slashes your setup time and technical headaches.
For smaller teams or companies just dipping their toes into data, this is often the most sensible route. It provides a clear, straightforward path to using data-driven marketing solutions without needing a platoon of data engineers. But that convenience has its trade-offs.
While an all-in-one suite gets you up and running quickly, you are ultimately living within the vendor’s walled garden. You trade deep customization and flexibility for simplicity and speed.
You get what the platform gives you, and you might start bumping into walls as your needs get more sophisticated. If the built-in reports don’t quite answer your most pressing business questions, you often don’t have many options to dig deeper.
The Composable Stack: The Custom-Built Approach
On the flip side, the composable stack is the “build-your-own” adventure. With this approach, you pick the best-of-the-best tools for each specific job and then wire them all together yourself. You might use Segment to gather data, Snowflake for your data warehouse, dbt to transform it, and a Reverse ETL tool to push those golden insights back into the tools your team actually uses.
This architecture gives you incredible flexibility and power. You’re in the driver’s seat, with full control over your data, allowing you to build custom workflows that match your business logic perfectly. For companies with complex data needs or those aiming to build a real competitive edge with their tech, this is the way to go. It’s a system designed to scale with you and adapt to whatever comes next.
Of course, all that freedom comes with a lot more responsibility. A composable stack requires serious technical chops to design, build, and keep running smoothly.
How to Choose Your Architectural Path
So, which way do you go? The right decision starts with an honest look at where your organization is today and where you want it to be tomorrow. There’s no magic formula, but these three factors will help point you in the right direction.
1. Company Stage and Scale
- Early-Stage Startups: Usually better off with an all-in-one suite. The name of the game is speed, and these platforms get you moving fast without needing a big technical team.
- Growth-Stage Companies: This is where things get interesting. As you scale, the cookie-cutter nature of a suite can start feeling restrictive, making a shift to a composable stack a smart strategic move.
- Enterprise Level: Almost always need a composable stack. They have to deal with complex data models, massive volumes of information, and the need for deep, custom analytics that a suite just can’t provide.
2. Technical Resources and Expertise
- Do you have data or RevOps engineers on staff who can build and manage complex data pipelines? If not, the upkeep of a composable stack could quickly become a nightmare. A service like RevOps JET can fill that gap, but you have to plan for it.
- If your team is mostly marketers who aren’t super technical, an all-in-one suite gives them the user-friendly environment they need to hit the ground running.
3. Budget and Long-Term Vision
- A suite might look cheaper at first, but costs can climb as you add more contacts or unlock premium features. A composable stack might cost more to set up, but it can lead to a lower total cost of ownership over time by preventing vendor lock-in.
- Think about how you see data in your company’s future. If your goal is to use data for advanced lead scoring, predictive modeling, and other powerful applications, a composable architecture gives you the solid foundation you’ll need to get there.
Your Roadmap to Implementing Data-Driven Marketing
https://www.youtube.com/embed/VpLdS4r4-yk
Having a great architectural plan is one thing, but turning that blueprint into a real, working system without derailing your entire marketing team is another challenge altogether. The secret? Don’t treat this like one giant, overwhelming project.
Instead, break it down into a series of manageable phases. This approach takes the risk out of the investment, lets you build momentum with some early wins, and makes sure you’re creating actual value every step of the way. Think of it as building your data-driven engine one piece at a time, proving it works before you go all in.
Phase 1: Audit and Goal Setting
Before you even think about buying new software or building a single data pipeline, you need to know where you stand and where you’re headed. This first phase is all about discovery. Start by mapping out every single data source you have—your CRM, website analytics, email platform, product usage data, everything.
Once you have a clear picture of your data landscape, it’s time to define what success actually looks like in concrete, measurable terms. A fuzzy goal like “improve marketing” won’t cut it. You need specific, business-focused objectives.
Here are a few examples of strong, data-driven goals:
- “Reduce customer churn by 10% in the next six months.”
- “Boost our MQL to SQL conversion rate from 3% to 5% by the end of the quarter.”
- “Increase customer lifetime value (LTV) by 15% for our enterprise customers.”
These kinds of goals give your whole project a clear purpose and a finish line.
Phase 2: Tool Selection and Integration
With your goals locked in, you can now pick the tools that will actually help you get there. Whether you opt for an all-in-one suite or piece together a more flexible, composable stack, this is where you bring the technology on board. But it’s about more than just buying software; it’s about making sure every piece of your stack can talk to each other.
This is often the most technical part of the journey. Getting your marketing automation integrations configured correctly is absolutely critical for a smooth flow of information. You have to ensure your CRM syncs perfectly with your data warehouse and that your analytics tools are fed clean, reliable data.
Phase 3: Pilot Program and Validation
Diving headfirst into a full, company-wide rollout is a classic mistake. The smarter move is to launch a small-scale pilot program to test everything in a controlled environment. Pick a single, high-impact use case to start with—maybe a lead nurturing campaign for a specific customer segment.
This pilot phase is your proof of concept. The main goal here is to show real, tangible value quickly. You need to prove to stakeholders that this investment is already paying off.
By testing on a small campaign, you can iron out the wrinkles, double-check your data models, and prove the ROI without disrupting the whole business. A successful pilot builds the confidence and internal buy-in you’ll need to keep going.
Phase 4: Scale and Optimize
Once your pilot has delivered measurable results, it’s time to hit the accelerator. This final phase is about rolling out your new data-driven solution across the rest of the organization. You’ll expand from that initial use case to other campaigns, channels, and teams.
But “scaling” doesn’t mean you’re done. This phase is also about continuous improvement. As more data flows through your system, you’ll uncover new insights and opportunities to refine your approach. This shift is happening everywhere; the global digital advertising and marketing market hit $667 billion in 2024. Today, online marketing accounts for about 72.7% of all ad spending, a massive jump from just 50% back in 2018.
This ongoing cycle of analyzing, acting, and refining is what separates the good data-driven teams from the truly great ones.
Measuring Success with the Right Marketing KPIs
So, you’ve built this amazing data-driven marketing engine. That’s a huge win, but it’s only half the story. The real question is: how do you know it’s actually working?
The proof isn’t in the complexity of the system but in your ability to measure what truly matters. We need to move past the classic “vanity metrics” like clicks and impressions and zero in on the Key Performance Indicators (KPIs) that directly tie to the bottom line.
Think of it this way: accurate KPI reporting is how you speak the language of the C-suite. It’s how you translate your team’s hard work into a clear story about revenue, efficiency, and growth. A great dashboard doesn’t just show you numbers; it tells you why things happened and helps you decide what to do next.
Moving Beyond Vanity Metrics
The entire point of a data-driven approach is to connect every marketing dollar spent to a tangible revenue outcome. This means getting laser-focused on metrics that show the health of your customer acquisition funnel and the long-term value of your customer relationships.
Everything else is just noise.
Three core KPIs really form the bedrock of this measurement framework: Customer Acquisition Cost (CAC), Customer Lifetime Value (LTV), and the MQL to SQL conversion rate. When you master these, you can confidently prove marketing’s contribution and make much smarter decisions about where to invest your budget. These metrics are also closely tied to what your sales team is tracking, and seeing the full picture is crucial. If you’re curious about how they align, check out these key sales KPIs examples in our other guide.
To really dig in, let’s break down the essential KPIs that every data-driven marketing team should have on their dashboard.
Essential Data-Driven Marketing KPIs
Here’s a look at the most important KPIs, what they’re telling you, and why they’re so critical for proving marketing’s value.
| KPI | What It Measures | Why It Matters |
|---|---|---|
| Customer Acquisition Cost (CAC) | The total sales and marketing cost required to sign one new customer. | It shows whether your growth is profitable and sustainable. A lower CAC means higher efficiency. |
| Customer Lifetime Value (LTV) | The total revenue you can expect from a single customer over the entire course of your relationship. | It provides a long-term view, helping you justify investments that might not have an immediate payback. |
| LTV to CAC Ratio | The ratio of a customer’s lifetime value to their acquisition cost. | This is the ultimate health check for a SaaS business model. A healthy ratio (ideally 3:1 or higher) means you have a profitable engine. |
| MQL to SQL Conversion Rate | The percentage of Marketing Qualified Leads that the sales team accepts as Sales Qualified Leads. | This is a direct measure of marketing and sales alignment. A high rate means marketing is delivering high-quality, sales-ready leads. |
| Marketing-Sourced Revenue | The total revenue generated directly from leads that originated from marketing campaigns. | This is the ultimate proof of marketing’s contribution, directly connecting your activities to closed-won deals. |
By consistently tracking these core KPIs, you turn your data from a simple reporting tool into a true strategic asset. You can finally answer the tough questions, defend your budget with confidence, and steer your strategy with precision.
Real-World Examples of Data-Driven Marketing in Action
It’s one thing to talk about the theory, but what does data-driven marketing actually look like in the real world? Let’s move past the buzzwords and look at a few examples of how companies are using customer data to get a serious leg up on the competition.
These aren’t just hypotheticals. They’re real-world scenarios where connecting the dots between different data sources led to smarter, more effective ways of doing business.
Sharpening Sales Focus with Smarter Lead Scoring
Picture a typical B2B SaaS sales team. They’re spending a huge chunk of their day chasing down leads that, frankly, are never going to buy. It’s a massive time sink. A smart data-driven approach flips this on its head with predictive lead scoring.
The idea is to build a model that pulls in all sorts of behavioral data—what pages a lead visits, how they engage with emails, what they do during a product trial—and then crunches those numbers to score each lead.
Instead of flying blind, sales reps can now focus their energy on the accounts that are genuinely showing strong buying signals. One company that implemented this saw a 40% jump in sales efficiency. Their team was no longer spinning their wheels on dead ends; they were spending their time actually closing deals.
Cutting Early Churn with Personalized Onboarding
A huge amount of customer churn happens in the first 90 days, and it’s almost always tied to a clunky or confusing onboarding experience. One company decided to tackle this problem directly by building dynamic, personalized onboarding flows. They started by tracking key actions and milestones using product analytics.
So, if a new user started to struggle with a certain feature, the system would automatically send them an email with a helpful guide or a quick video tutorial. This kind of proactive support, all driven by user data, helps customers feel like you’ve got their back.
The result? They cut early-stage churn by 25%. It turns out, moving from a generic checklist to a responsive, personal experience is a fantastic way to build a strong relationship right from the start.
Getting Ahead of Churn Before It Even Starts
The best way to deal with churn is to stop it before it happens. One subscription company did just that by building a proactive churn prevention model. They dove deep into their product usage data to spot the warning signs—things like a sudden drop in daily users or key features going untouched.
When the system flagged an account as high-risk, it automatically kicked off a retention campaign. That might be a special offer, a personal check-in from a customer success manager, or an invite to a training webinar. This is where AI really shines; in fact, companies using AI-powered tools report a 25% increase in conversion rates and can slash customer acquisition costs by up to 37% by getting their targeting right. You can discover more insights about AI in marketing statistics.
This data-driven early-warning system gave them the power to step in at just the right moment and save a customer relationship that might have otherwise been lost.
Frequently Asked Questions
Even with a solid plan, jumping into data-driven marketing always brings up a few questions. Let’s tackle some of the most common ones that pop up as teams move from idea to reality.
How Much Data Do I Need to Get Started?
You really don’t need a mountain of data to get going. The best place to start is with what you already have—your CRM and website analytics are goldmines. Always remember: quality beats quantity, every single time.
A classic mistake is trying to boil the ocean by collecting everything at once. Instead, pick one specific, valuable question you want to answer. Something like, “Which marketing channels are actually bringing us customers who stick around?” That focus helps you identify the clean, relevant data you need to find the answer and get an early win.
What Is the Biggest Mistake Companies Make?
Hands down, the single biggest pitfall is treating this like a tech project instead of a business strategy. So many companies buy a shiny, expensive new tool without a clear plan for how it’s going to move the needle. That’s a surefire way to waste a lot of money.
Strategy has to lead the way. First, figure out the exact customer experiences you want to create or the business goals you need to hit. Only then should you go looking for the technology that gets you there. Without that alignment, your fancy new software just ends up as expensive shelfware.
Can a Small Team Actually Implement This?
Absolutely. If you’re on a smaller team, the trick is to be realistic and start smart. Don’t try to do everything at once. Just focus on nailing one or two high-impact use cases first, like personalizing an email drip based on what a user did on your website last week.
Instead of building a complicated data stack from the ground up, smaller teams can get a huge boost from “all-in-one” platforms. Another great option is using managed services for your data pipelines, which gives you the engineering firepower without having to hire a dedicated team. The goal isn’t perfection on day one. It’s about starting a cycle of learning and improving. Even small, data-informed tweaks can add up to serious growth over time.
Ready to stop wrestling with messy data and start building a predictable growth engine? RevOps JET provides the production-grade data pipelines and CRM automation B2B SaaS teams need to execute a truly data-driven strategy. Skip the hiring headaches and see how our on-demand RevOps engineers can help you at https://revopsjet.com.